Addison: Fire Incidents, Texas (TX)
Where are fire incidents reported in Addison, TX
Something went wrong! Please refresh the page.
| Fire incidents reported | |
|---|---|
| Sreet name | Count |
| BELT LINE RD | 384 |
| MARSH LN | 166 |
| WESTGROVE DR | 148 |
| BROOKHAVEN CLUB DR | 120 |
| ADDISON RD | 116 |
| SPRING VALLEY RD | 108 |
| VITRUVIAN WAY | 106 |
| MIDWAY RD | 104 |
| SOJOURN DR | 50 |
| DALLAS PKY | 46 |
| DALLAS | 44 |
| QUORUM DR | 40 |
| ARAPAHO RD | 38 |
| BELTWAY DR | 38 |
| INWOOD RD | 38 |
| SPECTRUM DR | 36 |
| KELLER SPRINGS RD | 32 |
| LEDGEMONT LN | 20 |
| AIRPORT RUNWAY | 18 |
| LINDBERGH DR | 18 |
| ADDISON CIR | 16 |
| BILLY MITCHELL DR | 16 |
| ADDISON CI | 12 |
| DALLAS PKWY | 12 |
| MONTFORT DR | 12 |
| WESTGROVE | 12 |
| WITT PL | 12 |
| ARTIST WAY | 10 |
| CLAIRE CHENNAULT DR | 8 |
| FARMBROOK CT | 8 |
2002 - 2018 National Fire Incident Reporting System (NFIRS) incidents
- Incident types reported to NFIRS in Addison, TX
- 7,27750.6%Rescue & EMS
- 2,24215.6%Hazardous Condition
- 1,54010.7%False Alarm
- 1,2728.8%Good Intent Call
- 1,0917.6%Fire
- 9086.3%Service Call
- 480.3%Overpressure Rupture
- Fire incident types reported to NFIRS in Addison, TX
- 48544.5%Structure Fires
- 33030.2%Outside Fires
- 17916.4%Mobile Property/Vehicle Fires
- 978.9%Other
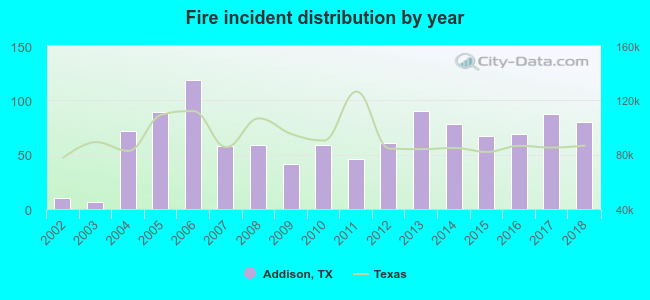 Based on the data from the years 2002 - 2018 the average number of fire incidents per year is 64. The highest number of reported fire incidents - 119 took place in 2006, and the least - 6 in 2003. The data has an increasing trend.
The average number of yearly fire incidents per 10k residents in Addison, TX compared to nearest cities:
(Note: Based on data for the last 3 years, including only cities with population 5,000 and above)
| Addison: | 50.9 |
| Farmers Branch: | 29.3 |
| Carrollton: | 24.4 |
| Richardson: | 18.0 |
| University Park: | 15.3 |
| Plano: | 14.4 |
| Coppell: | 20.3 |
| Highland Park: | 13.0 |
| The Colony: | 16.8 |
 The median response time based on all reported fire incidents is 5 minutes. This is lower compared to the state median value.
The median response time in Addison, TX compared to nearest cities:
(Note: Based on data for all years, including only cities with at least 500 fire incidents)
| Addison: | 5 minutes |
| Farmers Branch: | 5 minutes |
| Carrollton: | 5 minutes |
| Richardson: | 5 minutes |
| University Park: | 5 minutes |
| Plano: | 5 minutes |
| Coppell: | 5 minutes |
| The Colony: | 5 minutes |
| Irving: | 5 minutes |
 Based on the data from the years 2002 - 2018 the average number of fire-related casualties per year is 0. The highest number of casualties - 1 took place in 2004, and the lowest - 0 in 2002. The data has a constant trend.
The average number of casualties per 1,000 fire incidents is 4. This indicator was the highest - 17 in 2007, and the lowest 0 in 2002. The trend for injuries per 1,000 fire incidents is constant. Compared to the Texas value the number of casualties per 1,000 fire incidents is lower.
Based on the data from the years 2002 - 2018 the average number of fire-related casualties per year is 0. The highest number of casualties - 1 took place in 2004, and the lowest - 0 in 2002. The data has a constant trend.
The average number of casualties per 1,000 fire incidents is 4. This indicator was the highest - 17 in 2007, and the lowest 0 in 2002. The trend for injuries per 1,000 fire incidents is constant. Compared to the Texas value the number of casualties per 1,000 fire incidents is lower.Casualties per 1,000 incidents in Addison, TX compared to nearest cities:
(Note: Based on data for all years, including only cities with at least 500 fire incidents)
| Addison: | 4.6 |
| Farmers Branch: | 14.7 |
| Carrollton: | 14.1 |
| Richardson: | 24.9 |
| University Park: | 5.9 |
| Plano: | 11.1 |
| Coppell: | 8.6 |
| The Colony: | 7.1 |
| Irving: | 7.0 |
 29.0% incidents where reported in the morning and 71.0% in the evening. The most fires (18.1%) took place on Thursday, and the least (12.4%) on Saturday.
 Based on the 1,091 reports from years 2002 - 2018 most fires (10.1%) took place during March, and the least (6.7%) in May.
 Out of all 14,389 cases reported during the years 2002 - 2018, the most belonged to the categories: Rescue & EMS (50.6%), Hazardous Condition (15.6%), and False Alarm (10.7%).
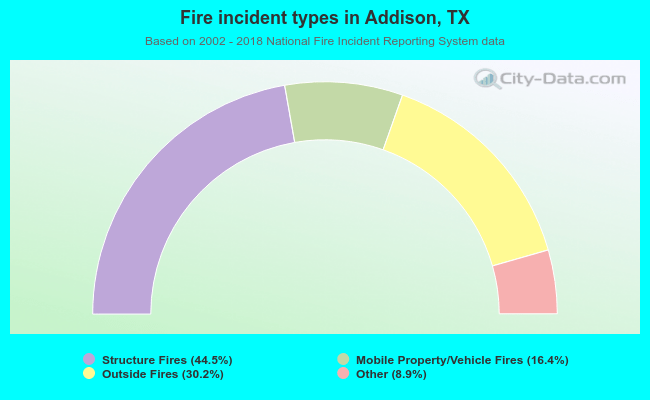 When looking into fire subcategories, the most incidents belonged to: Structure Fires (44.5%), and Outside Fires (30.2%).