Anamosa: Fire Incidents, Iowa (IA)
Where are fire incidents reported in Anamosa, IA
Something went wrong! Please refresh the page.
|
| |||||||||||||||||||||||||||||||||||||||||||||||||||||||||||||||||||||||||||||||||||||||||||||||||||||||||||||
2002 - 2018 National Fire Incident Reporting System (NFIRS) incidents
- Incident types reported to NFIRS in Anamosa, IA
- 34542.9%Fire
- 24830.8%Hazardous Condition
- 749.2%Rescue & EMS
- 526.5%False Alarm
- 445.5%Service Call
- 293.6%Good Intent Call
- 50.6%Special Incident
- 40.5%Severe Weather
- 30.4%Overpressure Rupture
- Fire incident types reported to NFIRS in Anamosa, IA
- 14542.0%Outside Fires
- 11934.5%Structure Fires
- 6719.4%Mobile Property/Vehicle Fires
- 144.1%Other
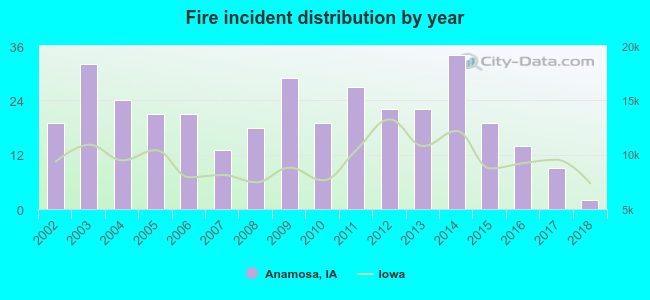 According to the data from the years 2002 - 2018 the average number of fire incidents per year is 20. The highest number of reported fires - 34 took place in 2014, and the least - 2 in 2018. The data has a declining trend.
The average number of yearly fire incidents per 10k residents in Anamosa, IA compared to nearest cities:
(Note: Based on data for the last 3 years, including only cities with population 5,000 and above)
| Anamosa: | 15.4 |
| Marion: | 16.2 |
| Hiawatha: | 46.8 |
| Cedar Rapids: | 20.4 |
| Manchester: | 28.2 |
| North Liberty: | 15.4 |
| Maquoketa: | 31.0 |
| Coralville: | 17.0 |
| Iowa City: | 9.8 |

 Based on the data from the years 2002 - 2018 the average number of fire-related yearly casualties is 0. The highest number of casualties - 3 took place in 2005, and the lowest - 0 in 2003. The data has a decreasing trend.
 26.7% incidents where reported in the morning and 73.3% in the evening. The most fires (17.7%) took place on Saturday, and the least (11.6%) on Friday.
 According to the 345 fires from years 2002 - 2018 most fires (15.9%) took place during April, and the least (3.5%) in February.
 Out of all 804 cases reported during the years 2002 - 2018, the most belonged to the categories: Fire (42.9%), Hazardous Condition (30.8%), and Rescue & EMS (9.2%).
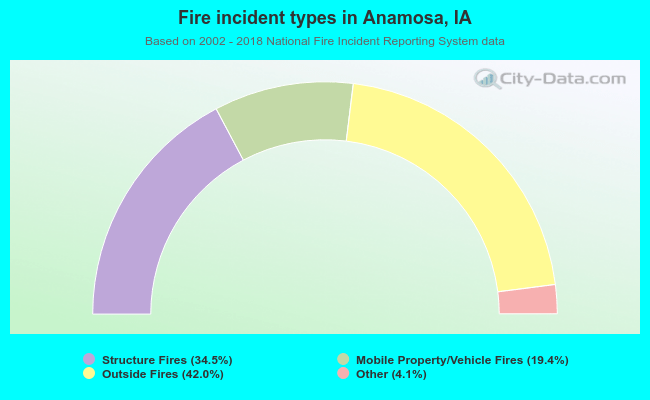 When looking into fire subcategories, the most reports belonged to: Outside Fires (42.0%), and Structure Fires (34.5%).