Arcadia: Fire Incidents, Florida (FL)
Where are fire incidents reported in Arcadia, FL
Something went wrong! Please refresh the page.
| Fire incidents reported | |
|---|---|
| Sreet name | Count |
| HIGHWAY 17 | 202 |
| HWY 17 S | 168 |
| HWY 70 | 144 |
| HWY 31 | 138 |
| HWY 17 | 136 |
| HIGHWAY 70 | 134 |
| OAK ST | 130 |
| CR 769 | 110 |
| HILLSBOROUGH AVE | 108 |
| HWY 72 | 74 |
| SHORES AVE | 66 |
| HARGRAVE ST | 62 |
| HICKORY ST | 62 |
| BREVARD AVE | 58 |
| FIRST AVE | 58 |
| THIRD AVE | 58 |
| CR 763 | 56 |
| POLK AVE | 56 |
| MAPLE DR | 54 |
| AIRPORT RD | 52 |
| CUBITIS AVE | 52 |
| HULL AVE | 52 |
| HWY 70 | 48 |
| FOURTH AVE | 46 |
| COUNTY ROAD 769 | 44 |
| HIGHWAY 31 | 44 |
| PINE WOOD AVE | 44 |
| ROAN ST | 44 |
| SECOND AVE | 44 |
| ARMADILLO TRL | 42 |
| Other | 1,852 |
2003 - 2018 National Fire Incident Reporting System (NFIRS) incidents
- Incident types reported to NFIRS in Arcadia, FL
- 12,75657.5%Rescue & EMS
- 4,23819.1%Fire
- 2,0269.1%Service Call
- 1,2815.8%Hazardous Condition
- 1,0464.7%Good Intent Call
- 7073.2%False Alarm
- 1290.6%Special Incident
- Fire incident types reported to NFIRS in Arcadia, FL
- 2,99570.7%Outside Fires
- 52512.4%Structure Fires
- 43010.1%Mobile Property/Vehicle Fires
- 2886.8%Other
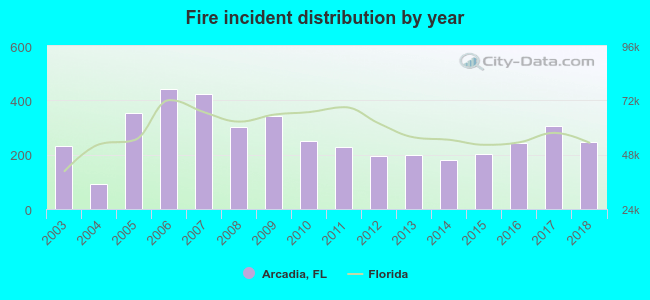 According to the data from the years 2003 - 2018 the average number of fires per year is 265. The highest number of reported fire incidents - 441 took place in 2006, and the least - 91 in 2004. The data has a rising trend.
The average number of yearly fire incidents per 10k residents in Arcadia, FL compared to nearest cities:
(Note: Based on data for the last 3 years, including only cities with population 5,000 and above)
| Arcadia: | 344.5 |
| Port Charlotte: | 59.1 |
| North Port: | 36.2 |
| Punta Gorda: | 138.1 |
| Warm Mineral Springs: | 14.8 |
| Sebring: | 218.2 |
| Myakka: | 0.9 |
| Avon Park: | 131.8 |
| Rotonda: | 5.3 |
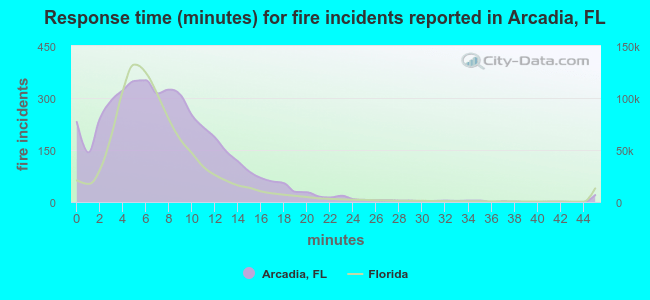 The median response time based on all reported fire incidents is 7 minutes. This is similar to the state median value.
The median response time in Arcadia, FL compared to nearest cities:
(Note: Based on data for all years, including only cities with at least 500 fire incidents)
| Arcadia: | 7 minutes |
| Port Charlotte: | 6 minutes |
| North Port: | 7 minutes |
| Wauchula: | 7 minutes |
| Punta Gorda: | 7 minutes |
| Lake Placid: | 11 minutes |
| Sebring: | 8 minutes |
| Avon Park: | 7 minutes |
| Englewood: | 6 minutes |
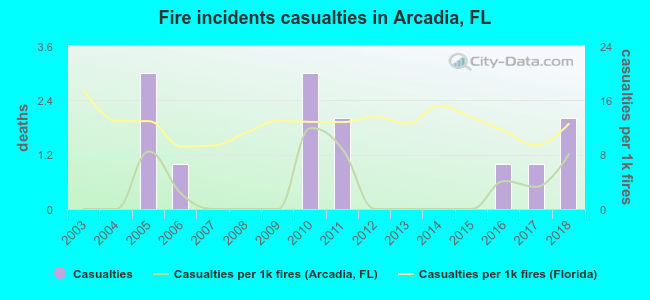 According to the reports from the years 2003 - 2018 the average number of fire-related casualties per year is 1. The highest number of reported injuries - 3 took place in 2005, and the lowest - 0 in 2003. The data has a rising trend.
The average number of injuries per 1,000 fire incidents is 3. This indicator was the highest - 12 in 2010, and the lowest 0 in 2003. The trend for injuries per 1,000 fires is growing. Compared to the Florida value the number of injuries per 1,000 fires is much lower.
According to the reports from the years 2003 - 2018 the average number of fire-related casualties per year is 1. The highest number of reported injuries - 3 took place in 2005, and the lowest - 0 in 2003. The data has a rising trend.
The average number of injuries per 1,000 fire incidents is 3. This indicator was the highest - 12 in 2010, and the lowest 0 in 2003. The trend for injuries per 1,000 fires is growing. Compared to the Florida value the number of injuries per 1,000 fires is much lower.Casualties per 1,000 incidents in Arcadia, FL compared to nearest cities:
(Note: Based on data for all years, including only cities with at least 500 fire incidents)
| Arcadia: | 3.1 |
| Port Charlotte: | 13.3 |
| North Port: | 4.3 |
| Wauchula: | 5.6 |
| Punta Gorda: | 5.3 |
| Lake Placid: | 0.9 |
| Sebring: | 1.2 |
| Avon Park: | 6.1 |
| Englewood: | 2.0 |
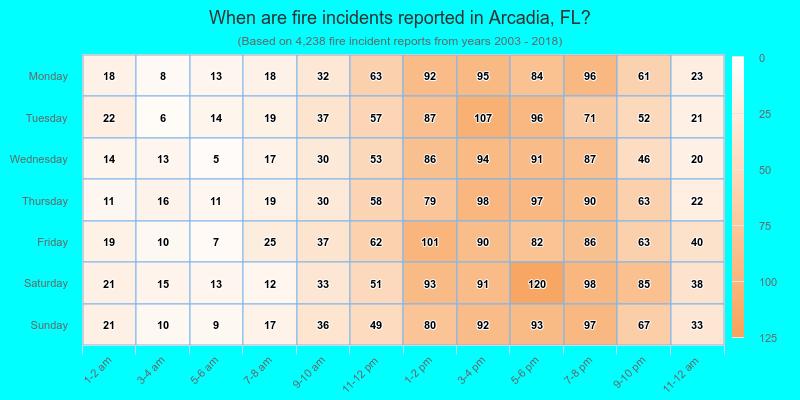
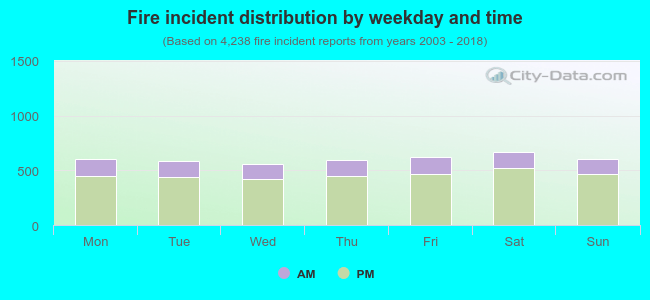 24.3% incidents where reported in the morning and 75.7% in the evening. The most fires (15.8%) took place on Saturday, and the least (13.1%) on Wednesday.
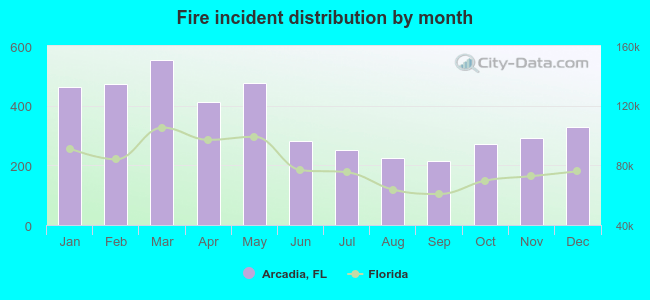 Based on the 4,238 reports from years 2003 - 2018 most fires (13.0%) took place during March, and the least (5.0%) in September.
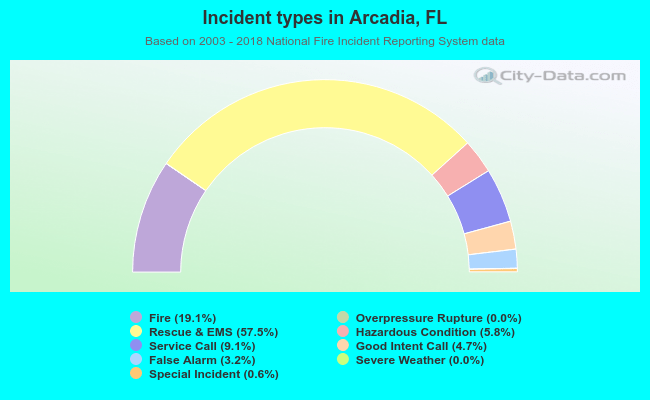 Out of all 22,189 cases reported during the years 2003 - 2018, the most belonged to the categories: Rescue & EMS (57.5%), Fire (19.1%), and Service Call (9.1%).
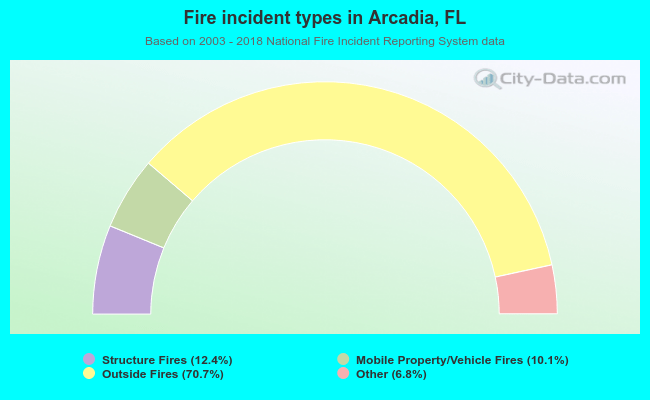 When looking into fire subcategories, the most reports belonged to: Outside Fires (70.7%), and Structure Fires (12.4%).