Ashland: Fire Incidents, Kentucky (KY)
Where are fire incidents reported in Ashland, KY
Something went wrong! Please refresh the page.
| Fire incidents reported | |
|---|---|
| Sreet name | Count |
| WINCHESTER AVE | 1,976 |
| THIRTEENTH ST | 96 |
| CENTRAL AVE | 92 |
| BLACKBURN AVE | 88 |
| LANSDOWNE DR | 86 |
| TWENTYNINTH ST | 86 |
| CARTER AVE | 78 |
| GREENUP AVE | 72 |
| BATH AVE | 54 |
| LEXINGTON AVE | 52 |
| CARL PERKINS DR | 50 |
| RIVERHILL DR | 42 |
| ROBERTS DR | 40 |
| NINTH ST | 32 |
| CLEMENTS DR | 30 |
| HILTON AVE | 30 |
| MOORE ST | 28 |
| MONTGOMERY AVE | 26 |
| BELMONT ST | 24 |
| FRONT ST | 24 |
| ARMCO RD | 22 |
| GARTRELL ST | 20 |
| SIXTH ST | 20 |
| FOREST AVE | 18 |
| LONG ST | 18 |
| MAIN ST | 18 |
| POLLARD RD | 18 |
| SHERWOOD DR | 18 |
| THIRTYNINTH ST | 18 |
| ASHLAND AVE | 16 |
2003 - 2018 National Fire Incident Reporting System (NFIRS) incidents
- Incident types reported to NFIRS in Ashland, KY
- 2,72531.8%Hazardous Condition
- 2,51329.3%Fire
- 1,35615.8%Rescue & EMS
- 7028.2%Service Call
- 5866.8%False Alarm
- 4715.5%Good Intent Call
- 1682.0%Overpressure Rupture
- 300.4%Severe Weather
- 180.2%Special Incident
- Fire incident types reported to NFIRS in Ashland, KY
- 1,50860.0%Structure Fires
- 58223.2%Outside Fires
- 25110.0%Mobile Property/Vehicle Fires
- 1726.8%Other
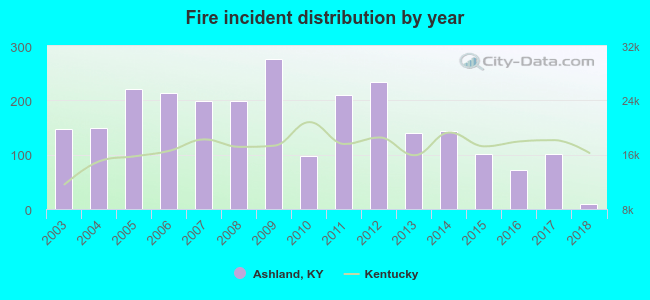 Based on the data from the years 2003 - 2018 the average number of fires per year is 157. The highest number of reported fires - 276 took place in 2009, and the least - 10 in 2018. The data has a declining trend.
The average number of yearly fire incidents per 10k residents in Ashland, KY compared to nearest cities:
(Note: Based on data for the last 3 years, including only cities with population 5,000 and above)
| Ashland: | 28.4 |
| Flatwoods: | 13.5 |
| Cannonsburg: | 3.1 |
 The median response time based on all reported fire incidents is 4 minutes. This is lower compared to the Kentucky median value.
The median response time in Ashland, KY compared to nearest cities:
(Note: Based on data for all years, including only cities with at least 500 fire incidents)
| Ashland: | 4 minutes |
| Catlettsburg: | 7 minutes |
| Greenup: | 8 minutes |
| Grayson: | 12 minutes |
| Louisa: | 8 minutes |
| Olive Hill: | 16 minutes |
 Based on the data from the years 2003 - 2018 the average number of fire-related casualties per year is 1. The highest number of casualties - 2 took place in 2003, and the lowest - 0 in 2004. The data has a declining trend.
The average number of casualties per 1,000 fire incidents is 4. This indicator was the highest - 20 in 2017, and the lowest 0 in 2004. The trend for injuries per 1,000 fire incidents is decreasing. Compared to the Kentucky value the number of casualties per 1,000 fires is lower.
Based on the data from the years 2003 - 2018 the average number of fire-related casualties per year is 1. The highest number of casualties - 2 took place in 2003, and the lowest - 0 in 2004. The data has a declining trend.
The average number of casualties per 1,000 fire incidents is 4. This indicator was the highest - 20 in 2017, and the lowest 0 in 2004. The trend for injuries per 1,000 fire incidents is decreasing. Compared to the Kentucky value the number of casualties per 1,000 fires is lower.Casualties per 1,000 incidents in Ashland, KY compared to nearest cities:
(Note: Based on data for all years, including only cities with at least 500 fire incidents)
| Ashland: | 3.6 |
| Catlettsburg: | 9.4 |
| Greenup: | 1.7 |
| Grayson: | 0.0 |
| Louisa: | 1.3 |
| Olive Hill: | 0.0 |
 31.4% incidents where reported in the morning and 68.6% in the evening. The most fires (15.3%) took place on Sunday, and the least (12.7%) on Wednesday.
 Based on the 2,513 fire incident reports from years 2003 - 2018 most fires (10.2%) took place during March, and the least (6.6%) in February.
 Out of all 8,569 cases reported during the years 2003 - 2018, the most belonged to the categories: Hazardous Condition (31.8%), Fire (29.3%), and Rescue & EMS (15.8%).
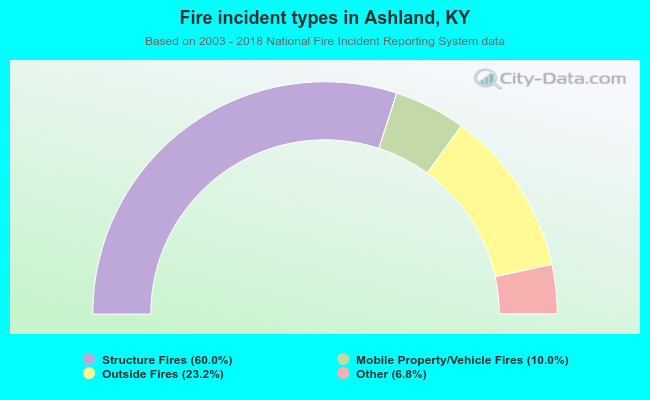 When looking into fire subcategories, the most incidents belonged to: Structure Fires (60.0%), and Outside Fires (23.2%).