Attica: Fire Incidents, Michigan (MI)
Where are fire incidents reported in Attica, MI
Something went wrong! Please refresh the page.
|
| |||||||||||||||||||||||||||||||||||||||||||||||||||||||||||||||||||||||||||||||||||||||||||||||||||||||||||||
2002 - 2018 National Fire Incident Reporting System (NFIRS) incidents
- Incident types reported to NFIRS in Attica, MI
- 35841.3%Fire
- 27031.2%Hazardous Condition
- 15017.3%Good Intent Call
- 354.0%False Alarm
- 242.8%Rescue & EMS
- 192.2%Service Call
- 60.7%Special Incident
- 20.2%Overpressure Rupture
- 20.2%Severe Weather
- Fire incident types reported to NFIRS in Attica, MI
- 18852.5%Structure Fires
- 8924.9%Outside Fires
- 6618.4%Mobile Property/Vehicle Fires
- 154.2%Other
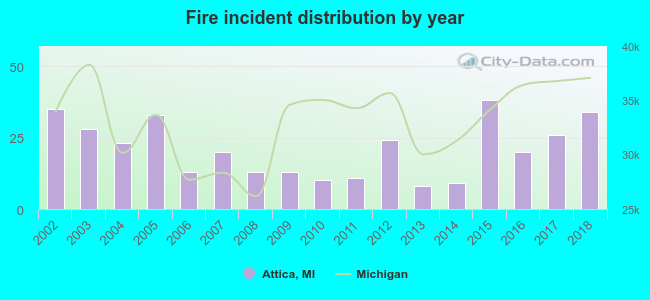 Based on the data from the years 2002 - 2018 the average number of fire incidents per year is 21. The highest number of reported fires - 38 took place in 2015, and the least - 8 in 2013. The data has a declining trend.
 38.0% incidents where reported in the morning and 62.0% in the evening. The most fires (19.0%) took place on Monday, and the least (9.8%) on Thursday.
 According to the 358 fire incident reports from years 2002 - 2018 most fires (19.3%) took place during April, and the least (3.6%) in November.
 Out of all 866 cases reported during the years 2002 - 2018, the most belonged to the categories: Fire (41.3%), Hazardous Condition (31.2%), and Good Intent Call (17.3%).
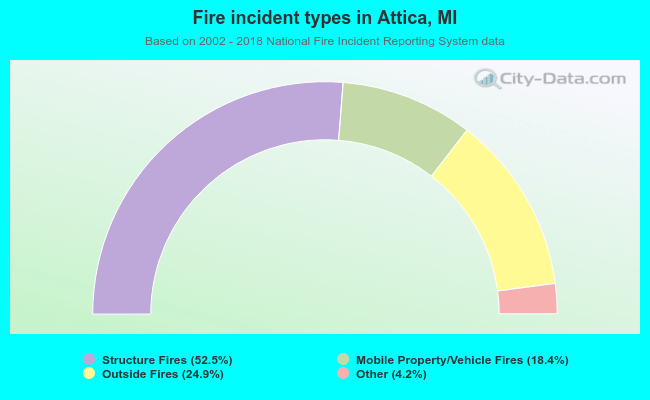 When looking into fire subcategories, the most reports belonged to: Structure Fires (52.5%), and Outside Fires (24.9%).