Auburn: Fire Incidents, Alabama (AL)
Where are fire incidents reported in Auburn, AL
Something went wrong! Please refresh the page.
| Fire incidents reported | |
|---|---|
| Sreet name | Count |
| COLLEGE ST | 375 |
| OPELIKA RD | 215 |
| DONAHUE DR | 210 |
| GLENN AVE | 170 |
| UNIVERSITY DR | 160 |
| MAGNOLIA AVE | 155 |
| I85 NB | 145 |
| LONGLEAF DR | 145 |
| WEBSTER RD | 130 |
| I85 | 120 |
| DEAN RD | 115 |
| INTERSTATE 85 | 100 |
| GOLF CLUB DR | 90 |
| I85 SB | 85 |
| US HIGHWAY 280 WEST | 80 |
| VETERANS BLVD | 75 |
| ROSS ST | 70 |
| DEKALB ST | 65 |
| GAY ST | 60 |
| COMMERCE DR | 55 |
| SHUG JORDAN PKY | 50 |
| MARTIN LUTHER KING DR | 45 |
| RICHLAND RD | 45 |
| SAMFORD AVE | 45 |
| LEE RD 12 | 40 |
| OGLETREE RD | 40 |
| OLD MILL RD | 40 |
| PERRY ST | 40 |
| SHELTON MILL RD | 40 |
| ENTERPRISE DR | 35 |
2009 - 2018 National Fire Incident Reporting System (NFIRS) incidents
- Incident types reported to NFIRS in Auburn, AL
- 12,02966.3%Rescue & EMS
- 1,83610.1%False Alarm
- 1,2436.9%Fire
- 1,1246.2%Hazardous Condition
- 1,0555.8%Service Call
- 6893.8%Good Intent Call
- 880.5%Special Incident
- 350.2%Severe Weather
- 340.2%Overpressure Rupture
- Fire incident types reported to NFIRS in Auburn, AL
- 55544.7%Outside Fires
- 39031.4%Structure Fires
- 23518.9%Mobile Property/Vehicle Fires
- 635.1%Other
 Based on the data from the years 2009 - 2018 the average number of fires per year is 124. The highest number of reported fire incidents - 183 took place in 2012, and the least - 2 in 2010. The data has a growing trend.
The average number of yearly fire incidents per 10k residents in Auburn, AL compared to nearest cities:
(Note: Based on data for the last 3 years, including only cities with population 5,000 and above)
| Auburn: | 24.6 |
| Opelika: | 39.8 |
| Beulah: | 1.6 |
| Smiths Station: | 80.0 |
| Smiths: | 13.9 |
| Valley: | 43.0 |
| Lanett: | 69.8 |
| Phenix City: | 37.5 |
| Alexander City: | 55.2 |
 The median response time based on all reported fire incidents is 5 minutes. This is lower compared to the state median value.
The median response time in Auburn, AL compared to nearest cities:
(Note: Based on data for all years, including only cities with at least 500 fire incidents)
| Auburn: | 5 minutes |
| Opelika: | 4 minutes |
| Smiths: | 8 minutes |
| Valley: | 6 minutes |
| Dadeville: | 11 minutes |
| Tallassee: | 10 minutes |
| Phenix City: | 4 minutes |
| Eclectic: | 9 minutes |
| Alexander City: | 5 minutes |
 28.7% incidents where reported in the morning and 71.3% in the evening. The most fires (15.0%) took place on Thursday, and the least (13.1%) on Tuesday.
 Based on the 1,243 fire incident reports from years 2009 - 2018 most fires (11.1%) took place during March, and the least (6.1%) in September.
 Out of all 18,133 cases reported during the years 2009 - 2018, the most belonged to the categories: Rescue & EMS (66.3%), False Alarm (10.1%), and Fire (6.9%).
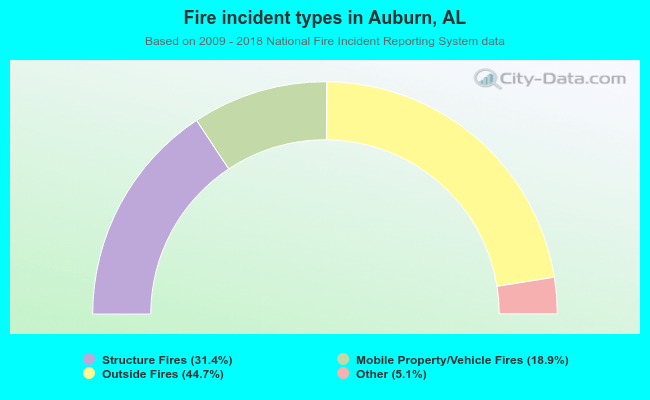 When looking into fire subcategories, the most reports belonged to: Outside Fires (44.7%), and Structure Fires (31.4%).