Auburn: Fire Incidents, Washington (WA)
Where are fire incidents reported in Auburn, WA
Something went wrong! Please refresh the page.
| Fire incidents reported | |
|---|---|
| Sreet name | Count |
| AUBURN WAY | 1,296 |
| A ST | 402 |
| M ST | 316 |
| 37 ST | 272 |
| I ST | 248 |
| D ST | 244 |
| R ST | 220 |
| AUBURN WY | 214 |
| MAIN ST | 198 |
| 312 ST | 164 |
| 15 ST | 162 |
| C ST | 158 |
| 8 ST | 116 |
| F ST | 114 |
| MILITARY RD | 114 |
| 320 ST | 108 |
| H ST | 104 |
| B ST | 98 |
| GREEN RIVER RD | 98 |
| K ST | 96 |
| AUBURN BLACK DIAM RD | 88 |
| ST | 86 |
| 3 ST | 84 |
| 24 ST | 82 |
| GREEN VALLEY RD | 82 |
| 17 ST | 80 |
| 34 AVE | 78 |
| 4 ST | 78 |
| 288 ST | 76 |
| 2 ST | 72 |
| Other | 1,346 |
2002 - 2018 National Fire Incident Reporting System (NFIRS) incidents
- Incident types reported to NFIRS in Auburn, WA
- 42,07763.9%Rescue & EMS
- 6,89410.5%Fire
- 4,5086.8%Good Intent Call
- 4,1346.3%Service Call
- 3,5485.4%Hazardous Condition
- 3,3195.0%False Alarm
- 1,1461.7%Special Incident
- 1210.2%Overpressure Rupture
- 730.1%Severe Weather
- Fire incident types reported to NFIRS in Auburn, WA
- 2,91042.2%Outside Fires
- 2,59537.6%Structure Fires
- 1,18917.2%Mobile Property/Vehicle Fires
- 2002.9%Other
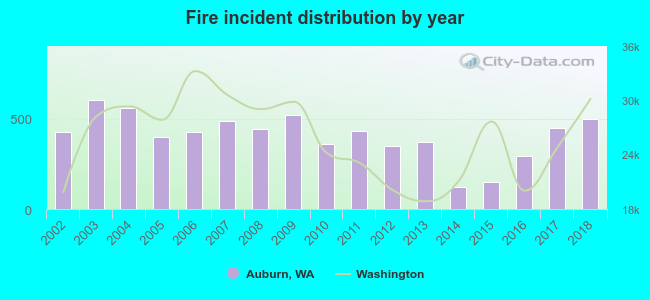 According to the data from the years 2002 - 2018 the average number of fire incidents per year is 406. The highest number of reported fire incidents - 603 took place in 2003, and the least - 124 in 2014. The data has an increasing trend.
The average number of yearly fire incidents per 10k residents in Auburn, WA compared to nearest cities:
(Note: Based on data for the last 3 years, including only cities with population 5,000 and above)
| Auburn: | 54.1 |
| Pacific: | 31.1 |
| Lake Tapps: | 10.1 |
| Kent: | 38.4 |
| Federal Way: | 46.6 |
| Edgewood: | 24.6 |
| Milton: | 38.0 |
| Sumner: | 73.0 |
| Covington: | 17.4 |
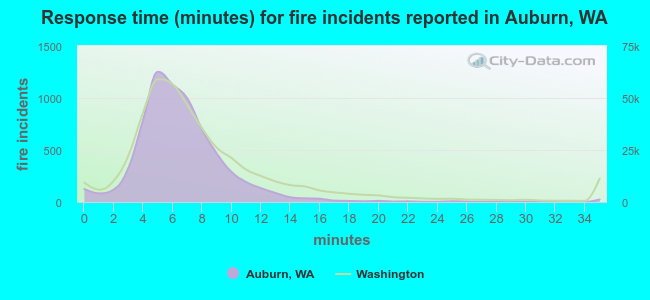 The median response time based on all reported fire incidents is 6 minutes. This is about the same as the state median value.
The median response time in Auburn, WA compared to nearest cities:
(Note: Based on data for all years, including only cities with at least 500 fire incidents)
| Auburn: | 6 minutes |
| Kent: | 6 minutes |
| Federal Way: | 6 minutes |
| Edgewood: | 7 minutes |
| Milton: | 7 minutes |
| Sumner: | 8 minutes |
| Covington: | 6 minutes |
| Des Moines: | 5 minutes |
| Bonney Lake: | 8 minutes |
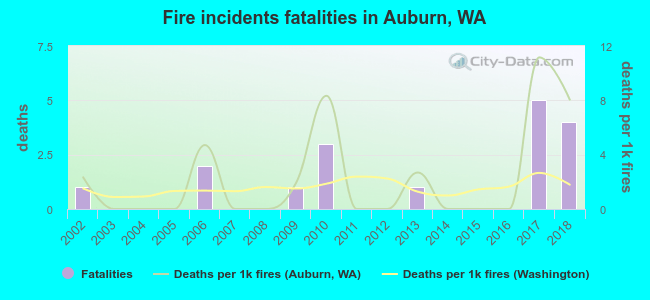 According to the data from the years 2002 - 2018 the average number of fire-related fatalities per year is 1. The highest number of deaths - 5 took place in 2017, and the lowest - 0 in 2003. The data has a growing trend.
The average number of deaths per 1,000 fires is 2. This indicator was the highest - 11 in 2017, and the lowest 0 in 2003. The trend for deaths per 1,000 incidents is growing. Compared to the state value the number of fatalities per 1,000 fire incidents is higher.
According to the data from the years 2002 - 2018 the average number of fire-related fatalities per year is 1. The highest number of deaths - 5 took place in 2017, and the lowest - 0 in 2003. The data has a growing trend.
The average number of deaths per 1,000 fires is 2. This indicator was the highest - 11 in 2017, and the lowest 0 in 2003. The trend for deaths per 1,000 incidents is growing. Compared to the state value the number of fatalities per 1,000 fire incidents is higher.
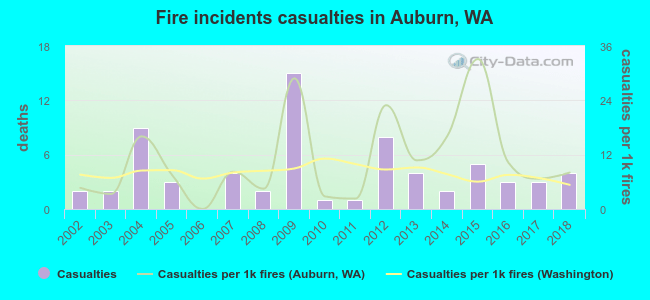 Based on the reports from the years 2002 - 2018 the average number of fire-related casualties per year is 4. The highest number of casualties - 15 took place in 2009, and the lowest - 0 in 2006. The data has an increasing trend.
The average number of injuries per 1,000 fires is 11. This indicator was the highest - 33 in 2015, and the lowest 0 in 2006. The trend for casualties per 1,000 incidents is rising. Compared to the state value the number of casualties per 1,000 fire incidents is higher.
Based on the reports from the years 2002 - 2018 the average number of fire-related casualties per year is 4. The highest number of casualties - 15 took place in 2009, and the lowest - 0 in 2006. The data has an increasing trend.
The average number of injuries per 1,000 fires is 11. This indicator was the highest - 33 in 2015, and the lowest 0 in 2006. The trend for casualties per 1,000 incidents is rising. Compared to the state value the number of casualties per 1,000 fire incidents is higher.Casualties per 1,000 incidents in Auburn, WA compared to nearest cities:
(Note: Based on data for all years, including only cities with at least 500 fire incidents)
| Auburn: | 9.9 |
| Kent: | 11.6 |
| Federal Way: | 21.1 |
| Edgewood: | 3.6 |
| Milton: | 3.5 |
| Sumner: | 1.7 |
| Covington: | 15.6 |
| Des Moines: | 16.0 |
| Bonney Lake: | 5.8 |
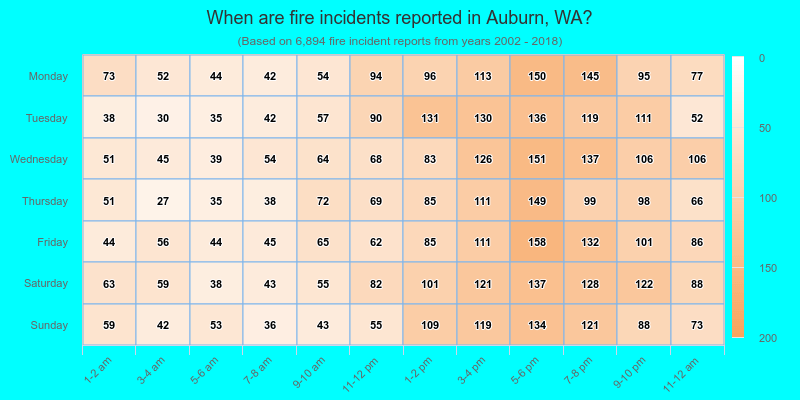
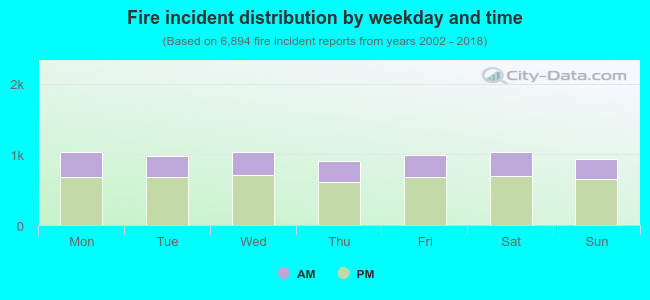 32.0% incidents where reported in the morning and 68.0% in the evening. The most fires (15.0%) took place on Saturday, and the least (13.1%) on Thursday.
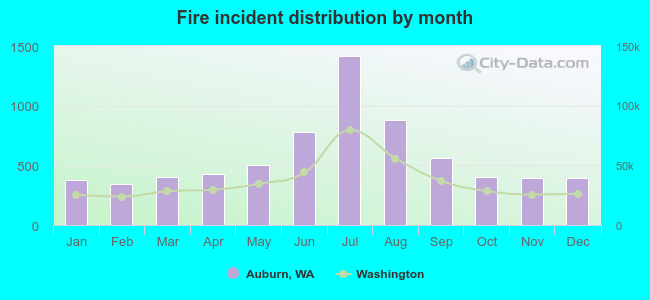 Based on the 6,894 incident reports from years 2002 - 2018 most fires (20.5%) took place during July, and the least (5.0%) in February.
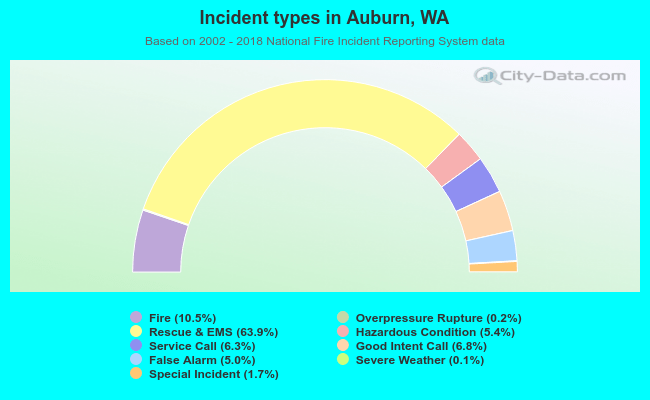 Out of all 65,820 cases reported during the years 2002 - 2018, the most belonged to the categories: Rescue & EMS (63.9%), Fire (10.5%), and Good Intent Call (6.8%).
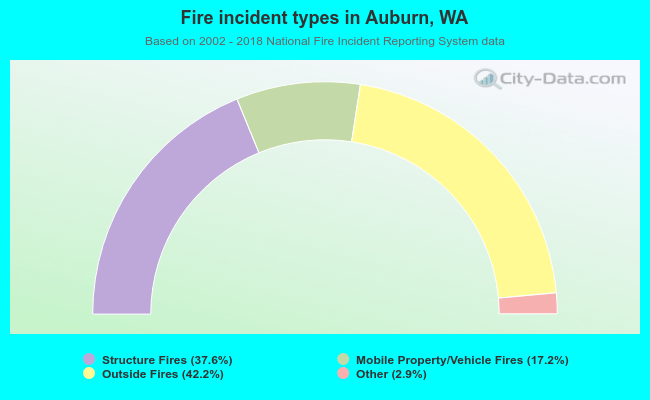 When looking into fire subcategories, the most incidents belonged to: Outside Fires (42.2%), and Structure Fires (37.6%).