Azle: Fire Incidents, Texas (TX)
Where are fire incidents reported in Azle, TX
Something went wrong! Please refresh the page.
| Fire incidents reported | |
|---|---|
| Sreet name | Count |
| BOYD RD | 112 |
| LIBERTY SCHOOL RD | 104 |
| BRIAR RD | 80 |
| JACKSBORO HWY | 78 |
| FM 730 | 74 |
| FM 730 HWY | 70 |
| STEWART ST | 66 |
| FLAT ROCK RD | 56 |
| SILVER CREEK AZLE RD | 52 |
| FM 1886 | 44 |
| KNOB HILL RD | 44 |
| NORTHWEST PKY | 44 |
| JARVIS LN | 42 |
| SOUTHEAST PKY | 42 |
| SANDY BEACH RD | 36 |
| VEAL STATION RD | 36 |
| PARK ST | 34 |
| RENO RD | 34 |
| SCOTLAND AVE | 34 |
| NINE MILE BRIDGE RD | 32 |
| PORTWOOD RD | 32 |
| F.M. 730 RD | 30 |
| FM 730 RD | 30 |
| CLAYTON RD | 28 |
| PARKWAY | 28 |
| TENDERFOOT TRL | 28 |
| JEREMIAH TRL | 26 |
| OVERLOOK TRL | 26 |
| PARKWAY ST | 26 |
| VILLAGE GARDEN DR | 26 |
| Other | 1,578 |
2002 - 2018 National Fire Incident Reporting System (NFIRS) incidents
- Incident types reported to NFIRS in Azle, TX
- 7,63349.0%Rescue & EMS
- 2,97219.1%Fire
- 1,95312.5%Hazardous Condition
- 1,3918.9%Service Call
- 1,1877.6%Good Intent Call
- 4092.6%False Alarm
- 210.1%Special Incident
- Fire incident types reported to NFIRS in Azle, TX
- 1,42247.8%Outside Fires
- 1,25342.2%Structure Fires
- 2418.1%Mobile Property/Vehicle Fires
- 561.9%Other
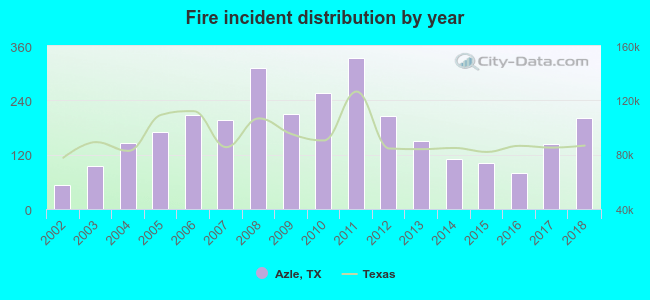 Based on the data from the years 2002 - 2018 the average number of fires per year is 175. The highest number of fire incidents - 334 took place in 2011, and the least - 52 in 2002. The data has a growing trend.
The average number of yearly fire incidents per 10k residents in Azle, TX compared to nearest cities:
(Note: Based on data for the last 3 years, including only cities with population 5,000 and above)
| Azle: | 122.9 |
| Eagle Mountain: | 3.4 |
| Briar: | 20.6 |
| Saginaw: | 31.8 |
| White Settlement: | 45.4 |
| River Oaks: | 21.3 |
| Benbrook: | 45.2 |
| Fort Worth: | 11.7 |
| Haltom City: | 42.3 |
 The median response time based on all reported fire incidents is 9 minutes. This is higher compared to the Texas median value.
The median response time in Azle, TX compared to nearest cities:
(Note: Based on data for all years, including only cities with at least 500 fire incidents)
| Azle: | 9 minutes |
| Newark: | 8 minutes |
| Lake Worth: | 5 minutes |
| Springtown: | 9 minutes |
| Saginaw: | 5 minutes |
| White Settlement: | 5 minutes |
| Rhome: | 10 minutes |
| Willow Park: | 5 minutes |
| Boyd: | 12 minutes |
 Based on the reports from the years 2002 - 2018 the average number of fire-related yearly casualties is 0. The highest number of reported injuries - 2 took place in 2005, and the lowest - 0 in 2002. The data has a constant trend.
The average number of casualties per 1,000 fire incidents is 3. This indicator was the highest - 12 in 2005, and the lowest 0 in 2002. The trend for injuries per 1,000 fires is constant. Compared to the state value the number of injuries per 1,000 incidents is much lower.
Based on the reports from the years 2002 - 2018 the average number of fire-related yearly casualties is 0. The highest number of reported injuries - 2 took place in 2005, and the lowest - 0 in 2002. The data has a constant trend.
The average number of casualties per 1,000 fire incidents is 3. This indicator was the highest - 12 in 2005, and the lowest 0 in 2002. The trend for injuries per 1,000 fires is constant. Compared to the state value the number of injuries per 1,000 incidents is much lower.Casualties per 1,000 incidents in Azle, TX compared to nearest cities:
(Note: Based on data for all years, including only cities with at least 500 fire incidents)
| Azle: | 2.7 |
| Newark: | 1.7 |
| Lake Worth: | 15.4 |
| Springtown: | 0.3 |
| Saginaw: | 8.3 |
| White Settlement: | 3.4 |
| Rhome: | 0.7 |
| Willow Park: | 1.3 |
| Boyd: | 0.9 |
 28.1% incidents where reported in the morning and 71.9% in the evening. The most fires (15.7%) took place on Sunday, and the least (11.9%) on Tuesday.
 Based on the 2,972 fire incidents from years 2002 - 2018 most fires (12.6%) took place during January, and the least (4.9%) in September.
 Out of all 15,592 cases reported during the years 2002 - 2018, the most belonged to the categories: Rescue & EMS (49.0%), Fire (19.1%), and Hazardous Condition (12.5%).
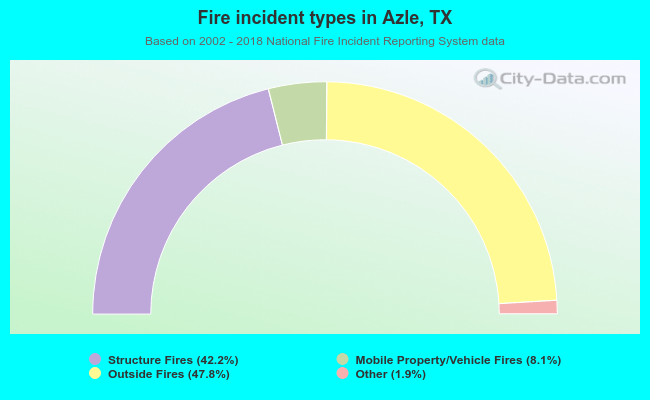 When looking into fire subcategories, the most reports belonged to: Outside Fires (47.8%), and Structure Fires (42.2%).