Ballwin: Fire Incidents, Missouri (MO)
Where are fire incidents reported in Ballwin, MO
Something went wrong! Please refresh the page.
| Fire incidents reported | |
|---|---|
| Sreet name | Count |
| MANCHESTER RD | 142 |
| MANCHESTER RD | 102 |
| NEW BALLWIN RD | 64 |
| STEAMBOAT LN | 46 |
| CLAYTON RD | 32 |
| CLAYTON RD | 24 |
| OLD BALLWIN RD | 20 |
| KEHRS MILL RD | 18 |
| RIES RD | 18 |
| WOODGREEN DR | 18 |
| KEHRS MILL RD | 14 |
| NEW BALLWIN RD | 14 |
| BIG BEND RD | 12 |
| CLAYMONT DR | 12 |
| RIES RD | 12 |
| SWEETCREEK DR | 12 |
| BOLTON DR | 10 |
| GOLFWOOD DR | 10 |
| HOLSHIRE WAY | 10 |
| LARK HILL LN | 10 |
| SEAWIND DR | 10 |
| SEAWIND DR | 10 |
| SKYLINE DR | 10 |
| WENDEVY CT | 10 |
| WOODGREEN | 10 |
| KENILWORTH CT | 8 |
| KIEFER CREEK RD | 8 |
| MEADOWBROOK COUNTRY CLUB ESTS | 8 |
| MEADOWBROOK DR | 8 |
| SHADOWOAK DR | 8 |
| Other | 425 |
2003 - 2018 National Fire Incident Reporting System (NFIRS) incidents
- Incident types reported to NFIRS in Ballwin, MO
- 7,79159.5%Rescue & EMS
- 1,56211.9%Hazardous Condition
- 1,1158.5%Fire
- 1,0538.0%Service Call
- 9757.5%False Alarm
- 5524.2%Good Intent Call
- 180.1%Severe Weather
- 140.1%Overpressure Rupture
- Fire incident types reported to NFIRS in Ballwin, MO
- 52947.4%Structure Fires
- 39035.0%Outside Fires
- 988.8%Mobile Property/Vehicle Fires
- 988.8%Other
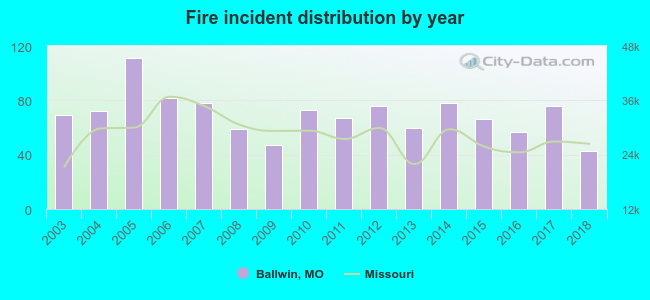 Based on the data from the years 2003 - 2018 the average number of fire incidents per year is 70. The highest number of fires - 111 took place in 2005, and the least - 43 in 2018. The data has a declining trend.
The average number of yearly fire incidents per 10k residents in Ballwin, MO compared to nearest cities:
(Note: Based on data for the last 3 years, including only cities with population 5,000 and above)
| Ballwin: | 19.2 |
| Ellisville: | 55.8 |
| Manchester: | 15.8 |
| Chesterfield: | 24.5 |
| Valley Park: | 33.4 |
| Town and Country: | 26.1 |
| Des Peres: | 19.9 |
| Wildwood: | 16.8 |
| Kirkwood: | 26.6 |
 The median response time based on all reported fire incidents is 5 minutes. This is lower compared to the Missouri median value.
The median response time in Ballwin, MO compared to nearest cities:
(Note: Based on data for all years, including only cities with at least 500 fire incidents)
| Ballwin: | 5 minutes |
| Ellisville: | 4 minutes |
| Manchester: | 5 minutes |
| Chesterfield: | 6 minutes |
| Valley Park: | 6 minutes |
| Wildwood: | 6 minutes |
| Fenton: | 6 minutes |
| Kirkwood: | 5 minutes |
| Creve Coeur: | 6 minutes |
 Based on the reports from the years 2003 - 2018 the average number of fire-related casualties per year is 1. The highest number of casualties - 7 took place in 2012, and the lowest - 0 in 2003. The data has an increasing trend.
The average number of casualties per 1,000 fires is 10. This indicator was the highest - 92 in 2012, and the lowest 0 in 2003. The trend for injuries per 1,000 incidents is rising. Compared to the Missouri value the number of casualties per 1,000 fires is higher.
Based on the reports from the years 2003 - 2018 the average number of fire-related casualties per year is 1. The highest number of casualties - 7 took place in 2012, and the lowest - 0 in 2003. The data has an increasing trend.
The average number of casualties per 1,000 fires is 10. This indicator was the highest - 92 in 2012, and the lowest 0 in 2003. The trend for injuries per 1,000 incidents is rising. Compared to the Missouri value the number of casualties per 1,000 fires is higher.Casualties per 1,000 incidents in Ballwin, MO compared to nearest cities:
(Note: Based on data for all years, including only cities with at least 500 fire incidents)
| Ballwin: | 9.9 |
| Ellisville: | 12.1 |
| Manchester: | 10.1 |
| Chesterfield: | 7.0 |
| Valley Park: | 4.4 |
| Wildwood: | 4.2 |
| Fenton: | 2.4 |
| Kirkwood: | 3.8 |
| Creve Coeur: | 6.4 |
 29.4% incidents where reported in the morning and 70.6% in the evening. The most fires (16.9%) took place on Saturday, and the least (12.8%) on Friday.
 Based on the 1,115 fires from years 2003 - 2018 most fires (10.8%) took place during March, and the least (5.5%) in September.
 Out of all 13,087 cases reported during the years 2003 - 2018, the most belonged to the categories: Rescue & EMS (59.5%), Hazardous Condition (11.9%), and Fire (8.5%).
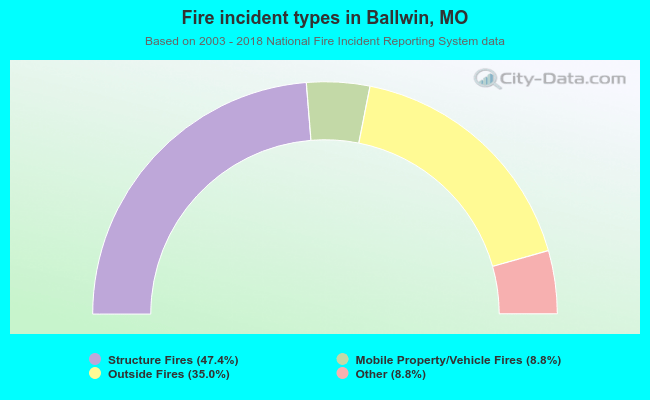 When looking into fire subcategories, the most incidents belonged to: Structure Fires (47.4%), and Outside Fires (35.0%).