Bangor: Fire Incidents, Maine (ME)
Where are fire incidents reported in Bangor, ME
Something went wrong! Please refresh the page.
| Fire incidents reported | |
|---|---|
| Sreet name | Count |
| UNION ST | 164 |
| MAIN ST | 132 |
| HAMMOND ST | 122 |
| OHIO ST | 118 |
| BROADWAY | 104 |
| STILLWATER AVE | 104 |
| ESSEX ST | 86 |
| STATE ST | 86 |
| CENTER ST | 56 |
| BANGOR MALL | 48 |
| FINSON RD | 44 |
| KENDUSKEAG AVE | 40 |
| COURT ST | 36 |
| HARLOW ST | 36 |
| HOGAN RD | 36 |
| ODLIN RD | 34 |
| THIRD ST | 34 |
| FRENCH ST | 32 |
| HANCOCK ST | 30 |
| SECOND ST | 30 |
| FOREST AVE | 28 |
| FIRST ST | 26 |
| GARLAND ST | 26 |
| GRIFFIN RD | 26 |
| HUSSON AVE | 26 |
| BOLLING DR | 24 |
| ELM ST | 24 |
| GROVE ST | 24 |
| CEDAR ST | 22 |
| FIFTEENTH ST | 22 |
| Other | 1,138 |
2002 - 2018 National Fire Incident Reporting System (NFIRS) incidents
- Incident types reported to NFIRS in Bangor, ME
- 28,80971.2%Rescue & EMS
- 2,7586.8%Fire
- 2,7086.7%Service Call
- 2,3955.9%False Alarm
- 2,2715.6%Hazardous Condition
- 1,4553.6%Good Intent Call
- Fire incident types reported to NFIRS in Bangor, ME
- 1,24245.0%Structure Fires
- 92933.7%Outside Fires
- 35512.9%Mobile Property/Vehicle Fires
- 2328.4%Other
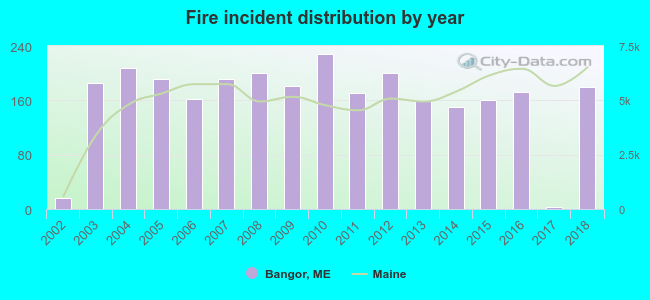 Based on the data from the years 2002 - 2018 the average number of fire incidents per year is 162. The highest number of reported fires - 228 took place in 2010, and the least - 3 in 2017. The data has an increasing trend.
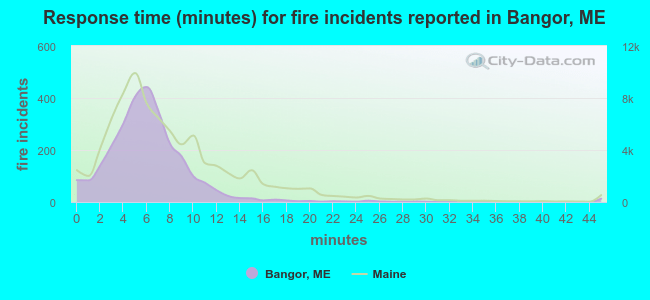 The median response time based on all reported fire incidents is 6 minutes. This is close to the Maine median value.
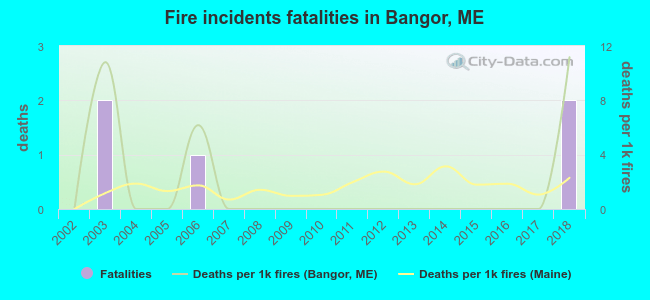 Based on the reports from the years 2002 - 2018 the average number of fire-related fatalities per year is 0. The highest number of reported deaths - 2 took place in 2003, and the lowest - 0 in 2002. The data has a rising trend.
The average number of deaths per 1,000 fires is 2. This indicator was the highest - 11 in 2018, and the lowest 0 in 2002. The trend for deaths per 1,000 fires is increasing. Compared to the state value the number of fatalities per 1,000 fire incidents is similar.
Based on the reports from the years 2002 - 2018 the average number of fire-related fatalities per year is 0. The highest number of reported deaths - 2 took place in 2003, and the lowest - 0 in 2002. The data has a rising trend.
The average number of deaths per 1,000 fires is 2. This indicator was the highest - 11 in 2018, and the lowest 0 in 2002. The trend for deaths per 1,000 fires is increasing. Compared to the state value the number of fatalities per 1,000 fire incidents is similar.Deaths per 1,000 incidents in Bangor, ME compared to nearest cities:
(Note: Based on data for all years, including only cities with at least 2,500 fire incidents)
| Bangor: | 1.8 |
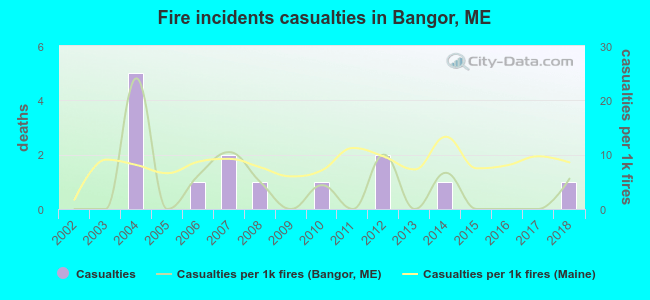 According to the data from the years 2002 - 2018 the average number of fire-related yearly casualties is 1. The highest number of injuries - 5 took place in 2004, and the lowest - 0 in 2002. The data has a growing trend.
The average number of injuries per 1,000 fire incidents is 4. This indicator was the highest - 24 in 2004, and the lowest 0 in 2002. The trend for casualties per 1,000 incidents is rising. Compared to the Maine value the number of casualties per 1,000 incidents is lower.
According to the data from the years 2002 - 2018 the average number of fire-related yearly casualties is 1. The highest number of injuries - 5 took place in 2004, and the lowest - 0 in 2002. The data has a growing trend.
The average number of injuries per 1,000 fire incidents is 4. This indicator was the highest - 24 in 2004, and the lowest 0 in 2002. The trend for casualties per 1,000 incidents is rising. Compared to the Maine value the number of casualties per 1,000 incidents is lower.
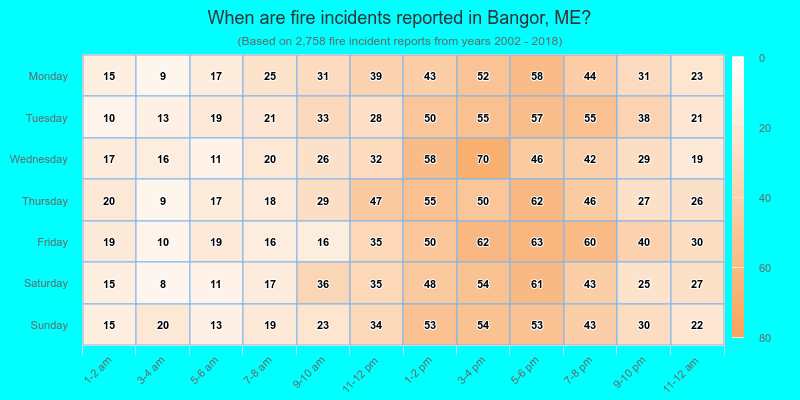
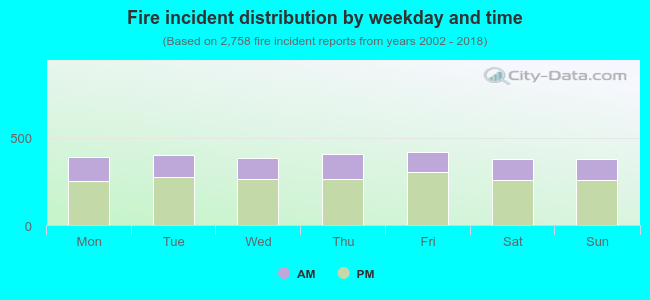 32.0% incidents where reported in the morning and 68.0% in the evening. The most fires (15.2%) took place on Friday, and the least (13.7%) on Sunday.
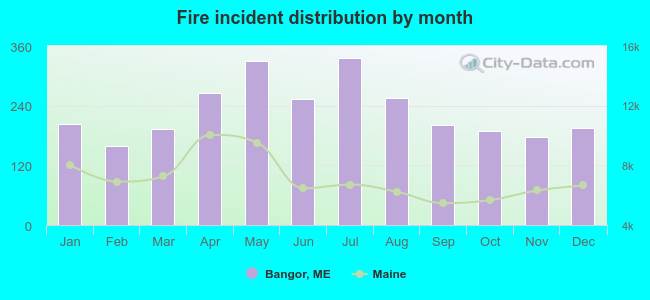 According to the 2,758 incident reports from years 2002 - 2018 most fires (12.2%) took place during July, and the least (5.7%) in February.
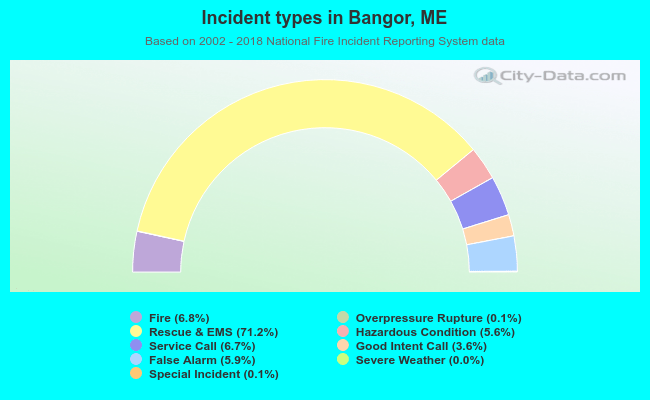 Out of all 40,456 cases reported during the years 2002 - 2018, the most belonged to the categories: Rescue & EMS (71.2%), Fire (6.8%), and Service Call (6.7%).
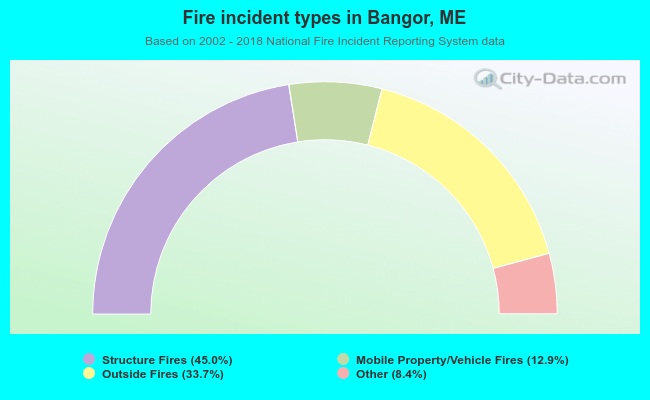 When looking into fire subcategories, the most incidents belonged to: Structure Fires (45.0%), and Outside Fires (33.7%).