Barnesville: Fire Incidents, Georgia (GA)
Where are fire incidents reported in Barnesville, GA
Something went wrong! Please refresh the page.
|
| |||||||||||||||||||||||||||||||||||||||||||||||||||||||||||||||||||||||||||||||||||||||||||||||||||||||||||||
2002 - 2018 National Fire Incident Reporting System (NFIRS) incidents
- Incident types reported to NFIRS in Barnesville, GA
- 2,28040.3%Rescue & EMS
- 1,59128.1%Fire
- 99917.6%Good Intent Call
- 4528.0%Hazardous Condition
- 1753.1%False Alarm
- 1362.4%Service Call
- 160.3%Severe Weather
- 90.2%Special Incident
- 60.1%Overpressure Rupture
- Fire incident types reported to NFIRS in Barnesville, GA
- 80750.7%Outside Fires
- 48330.4%Structure Fires
- 26716.8%Mobile Property/Vehicle Fires
- 342.1%Other
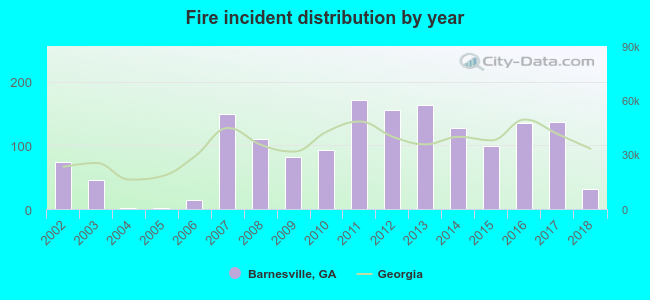 According to the data from the years 2002 - 2018 the average number of fire incidents per year is 94. The highest number of reported fire incidents - 171 took place in 2011, and the least - 1 in 2004. The data has a dropping trend.
The average number of yearly fire incidents per 10k residents in Barnesville, GA compared to nearest cities:
(Note: Based on data for the last 3 years, including only cities with population 5,000 and above)
| Barnesville: | 151.9 |
| Thomaston: | 152.7 |
| Griffin: | 128.7 |
| Locust Grove: | 116.9 |
| Hampton: | 159.3 |
| Lizella: | 21.5 |
| McDonough: | 109.3 |
| Fayetteville: | 114.4 |
| Macon: | 117.8 |
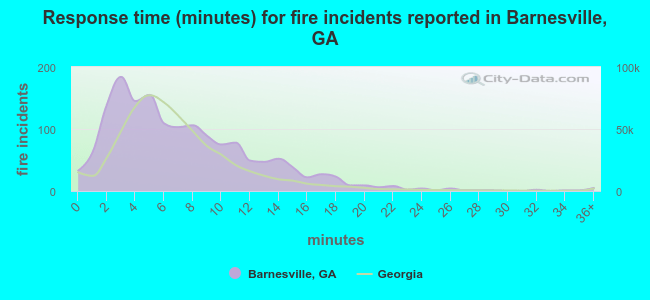 The median response time based on all reported fire incidents is 6 minutes. This is close to the Georgia median value.
The median response time in Barnesville, GA compared to nearest cities:
(Note: Based on data for all years, including only cities with at least 500 fire incidents)
| Barnesville: | 6 minutes |
| Forsyth: | 6 minutes |
| Thomaston: | 5 minutes |
| Griffin: | 5 minutes |
| Jackson: | 6 minutes |
| Locust Grove: | 8 minutes |
| Hampton: | 8 minutes |
| Roberta: | 12 minutes |
| McDonough: | 7 minutes |
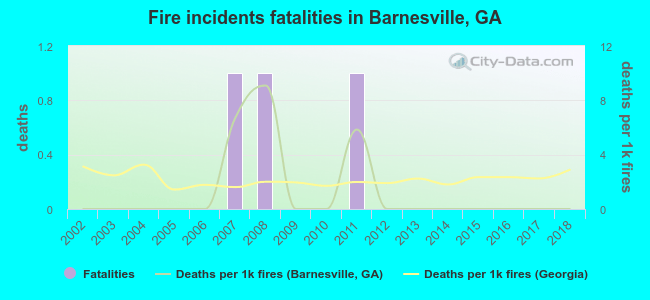 Based on the reports from the years 2002 - 2018 the average number of fire-related fatalities per year is 0. The highest number of reported deaths - 1 took place in 2007, and the lowest - 0 in 2002. The data has a constant trend.
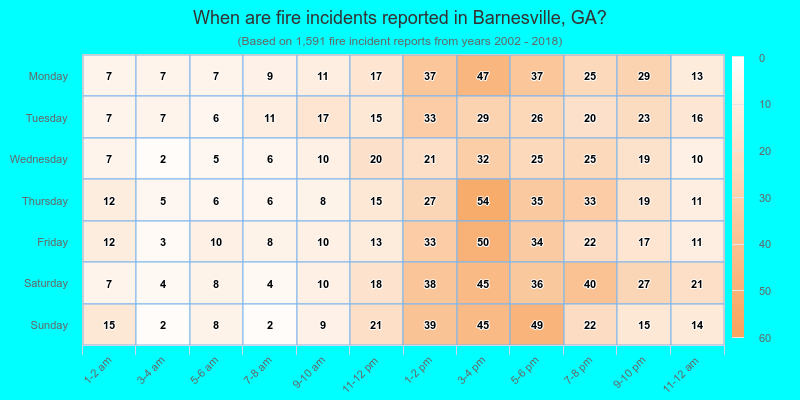
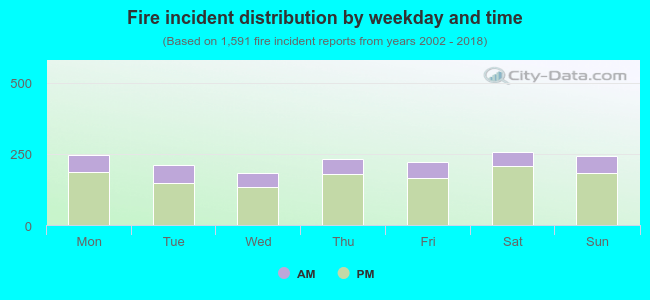 24.3% incidents where reported in the morning and 75.7% in the evening. The most fires (16.2%) took place on Saturday, and the least (11.4%) on Wednesday.
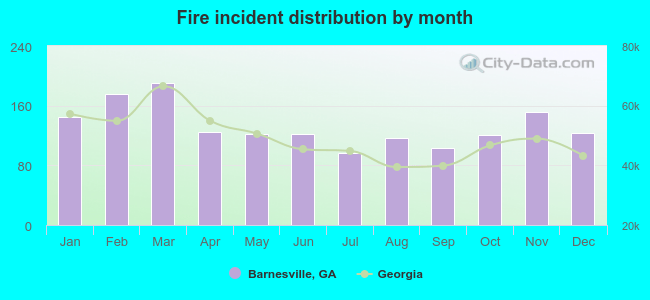 Based on the 1,591 fires from years 2002 - 2018 most fires (12.0%) took place during March, and the least (6.0%) in July.
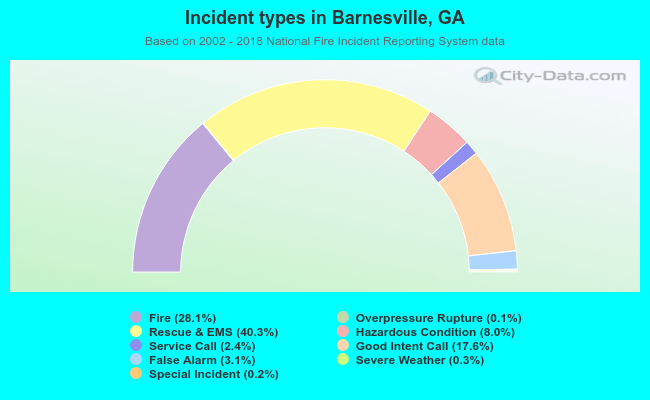 Out of all 5,664 cases reported during the years 2002 - 2018, the most belonged to the categories: Rescue & EMS (40.3%), Fire (28.1%), and Good Intent Call (17.6%).
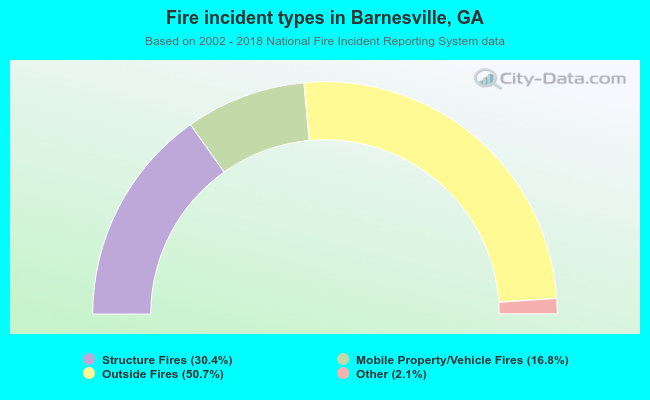 When looking into fire subcategories, the most incidents belonged to: Outside Fires (50.7%), and Structure Fires (30.4%).