Barstow: Fire Incidents, California (CA)
Where are fire incidents reported in Barstow, CA
Something went wrong! Please refresh the page.
|
| |||||||||||||||||||||||||||||||||||||||||||||||||||||||||||||||||||||||||||||||||||||||||||||||||||||||||||||
2005 - 2018 National Fire Incident Reporting System (NFIRS) incidents
- Incident types reported to NFIRS in Barstow, CA
- 36648.2%Fire
- 15220.0%Good Intent Call
- 12416.3%Hazardous Condition
- 668.7%Rescue & EMS
- 496.5%Service Call
- 20.3%Special Incident
- Fire incident types reported to NFIRS in Barstow, CA
- 16545.1%Structure Fires
- 12333.6%Outside Fires
- 7319.9%Mobile Property/Vehicle Fires
- 51.4%Other
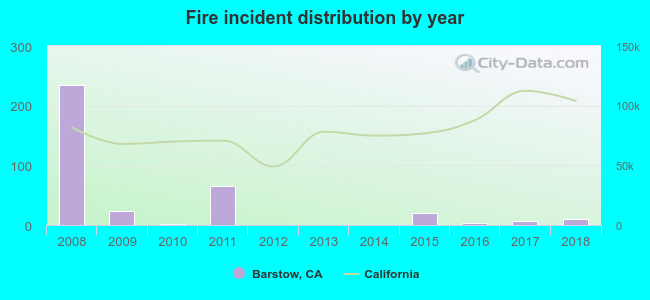 According to the data from the years 2005 - 2018 the average number of fire incidents per year is 33. The highest number of fire incidents - 235 took place in 2008, and the least - 0 in 2012. The data has a declining trend.
The average number of yearly fire incidents per 10k residents in Barstow, CA compared to nearest cities:
(Note: Based on data for the last 3 years, including only cities with population 5,000 and above)
| Barstow: | 2.7 |
| Apple Valley: | 8.1 |
| Spring Valley Lake: | 4.1 |
| Lucerne Valley: | 30.4 |
| Victorville: | 11.2 |
| Adelanto: | 16.2 |
| Hesperia: | 10.4 |
| Oak Hills: | 2.8 |
| Phelan: | 32.6 |

 32.2% incidents where reported in the morning and 67.8% in the evening. The most fires (17.5%) took place on Saturday, and the least (12.3%) on Monday.
 Based on the 366 reports from years 2005 - 2018 most fires (13.9%) took place during June, and the least (4.4%) in December.
 Out of all 759 cases reported during the years 2005 - 2018, the most belonged to the categories: Fire (48.2%), Service Call (20.0%), and Rescue & EMS (16.3%).
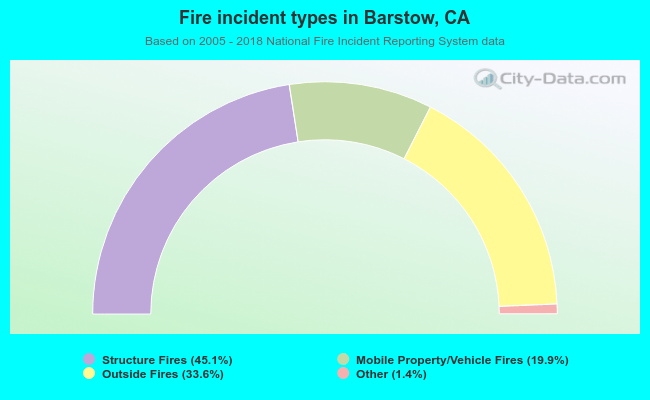 When looking into fire subcategories, the most reports belonged to: Structure Fires (45.1%), and Outside Fires (33.6%).