Baton Rouge: Fire Incidents, Louisiana (LA)
Where are fire incidents reported in Baton Rouge, LA
Something went wrong! Please refresh the page.
| Fire incidents reported | |
|---|---|
| Sreet name | Count |
| AIRLINE HWY | 690 |
| JEFFERSON HWY | 474 |
| FLORIDA BLVD | 360 |
| HOOPER RD | 354 |
| BLUEBONNET BLVD | 324 |
| GREENWELL SPRINGS RD | 310 |
| PLANK RD | 306 |
| HIGHLAND RD | 304 |
| PERKINS RD | 266 |
| INTERSTATE 10 HWY | 232 |
| OLD HAMMOND HWY | 216 |
| SIEGEN LANE | 212 |
| BURBANK DR | 202 |
| SCENIC HWY | 190 |
| COURSEY BLVD | 180 |
| SULLIVAN RD | 178 |
| JOOR RD | 168 |
| NICHOLSON DR | 156 |
| GREENWELL ST | 152 |
| FOSTER DR | 140 |
| FLANNERY RD | 130 |
| JONES CREEK RD | 126 |
| HARRELLS FERRY RD | 122 |
| NED AVE | 122 |
| GARDERE LANE | 116 |
| NORTH ST | 114 |
| SHERWOOD FOREST BLVD | 114 |
| VICTORIA DR | 114 |
| TIGER BEND RD | 112 |
| ARDENWOOD DR | 110 |
| Other | 7,993 |
2002 - 2018 National Fire Incident Reporting System (NFIRS) incidents
- Incident types reported to NFIRS in Baton Rouge, LA
- 119,23856.4%Rescue & EMS
- 37,47417.7%Good Intent Call
- 16,7777.9%Service Call
- 15,2437.2%False Alarm
- 14,5876.9%Fire
- 7,6583.6%Hazardous Condition
- 2280.1%Severe Weather
- Fire incident types reported to NFIRS in Baton Rouge, LA
- 6,77846.5%Structure Fires
- 4,23229.0%Outside Fires
- 3,10321.3%Mobile Property/Vehicle Fires
- 4743.2%Other
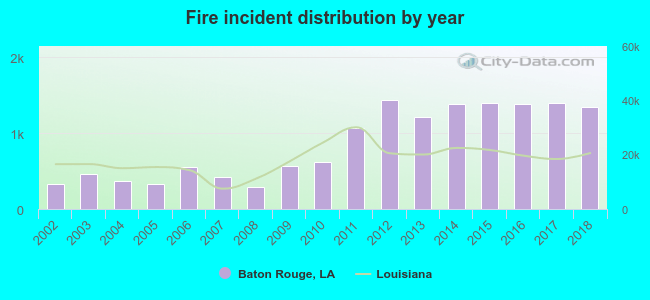 Based on the data from the years 2002 - 2018 the average number of fire incidents per year is 858. The highest number of reported fire incidents - 1,432 took place in 2012, and the least - 293 in 2008. The data has an increasing trend.
The average number of yearly fire incidents per 10k residents in Baton Rouge, LA compared to nearest cities:
(Note: Based on data for the last 3 years, including only cities with population 5,000 and above)
| Baton Rouge: | 60.1 |
| Port Allen: | 77.8 |
| Monticello: | 1.9 |
| Baker: | 59.3 |
| Denham Springs: | 383.0 |
| Plaquemine: | 100.1 |
| Zachary: | 82.4 |
| Prairieville: | 53.8 |
| Walker: | 191.8 |
 The median response time based on all reported fire incidents is 4 minutes. This is lower than the Louisiana median value.
The median response time in Baton Rouge, LA compared to nearest cities:
(Note: Based on data for all years, including only cities with at least 500 fire incidents)
| Baton Rouge: | 4 minutes |
| Port Allen: | 5 minutes |
| Baker: | 5 minutes |
| Denham Springs: | 7 minutes |
| Plaquemine: | 5 minutes |
| Zachary: | 6 minutes |
| Prairieville: | 6 minutes |
| Walker: | 8 minutes |
| Gonzales: | 6 minutes |
 Based on the reports from the years 2002 - 2018 the average number of fire-related yearly deaths is 2. The highest number of reported deaths - 7 took place in 2014, and the lowest - 0 in 2002. The data has a growing trend.
The average number of fatalities per 1,000 fires is 1. This indicator was the highest - 5 in 2014, and the lowest 0 in 2002. The trend for deaths per 1,000 incidents is increasing. Compared to the state value the number of deaths per 1,000 fires is similar.
Based on the reports from the years 2002 - 2018 the average number of fire-related yearly deaths is 2. The highest number of reported deaths - 7 took place in 2014, and the lowest - 0 in 2002. The data has a growing trend.
The average number of fatalities per 1,000 fires is 1. This indicator was the highest - 5 in 2014, and the lowest 0 in 2002. The trend for deaths per 1,000 incidents is increasing. Compared to the state value the number of deaths per 1,000 fires is similar.Deaths per 1,000 incidents in Baton Rouge, LA compared to nearest cities:
(Note: Based on data for all years, including only cities with at least 2,500 fire incidents)
| Baton Rouge: | 2.1 |
| Denham Springs: | 2.2 |
| Hammond: | 1.4 |
 According to the reports from the years 2002 - 2018 the average number of fire-related casualties per year is 6. The highest number of reported casualties - 14 took place in 2015, and the lowest - 1 in 2013. The data has an increasing trend.
The average number of casualties per 1,000 fires is 7. This indicator was the highest - 10 in 2015, and the lowest 1 in 2013. The trend for casualties per 1,000 incidents is dropping. Compared to the Louisiana value the number of casualties per 1,000 fires is similar.
According to the reports from the years 2002 - 2018 the average number of fire-related casualties per year is 6. The highest number of reported casualties - 14 took place in 2015, and the lowest - 1 in 2013. The data has an increasing trend.
The average number of casualties per 1,000 fires is 7. This indicator was the highest - 10 in 2015, and the lowest 1 in 2013. The trend for casualties per 1,000 incidents is dropping. Compared to the Louisiana value the number of casualties per 1,000 fires is similar.Casualties per 1,000 incidents in Baton Rouge, LA compared to nearest cities:
(Note: Based on data for all years, including only cities with at least 500 fire incidents)
| Baton Rouge: | 6.4 |
| Port Allen: | 21.7 |
| Baker: | 9.0 |
| Denham Springs: | 15.1 |
| Plaquemine: | 3.0 |
| Zachary: | 7.7 |
| Prairieville: | 3.1 |
| Walker: | 6.4 |
| Gonzales: | 2.3 |
 34.9% incidents where reported in the morning and 65.1% in the evening. The most fires (15.8%) took place on Saturday, and the least (13.1%) on Wednesday.
 According to the 14,587 incident reports from years 2002 - 2018 most fires (9.7%) took place during October, and the least (6.9%) in June.
 Out of all 211,381 cases reported during the years 2002 - 2018, the most belonged to the categories: Rescue & EMS (56.4%), Good Intent Call (17.7%), and Service Call (7.9%).
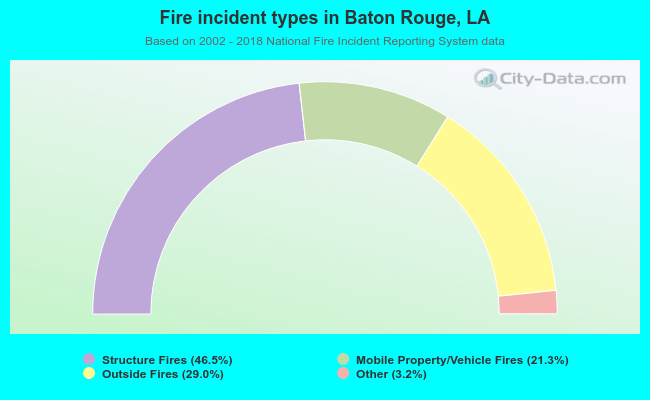 When looking into fire subcategories, the most reports belonged to: Structure Fires (46.5%), and Outside Fires (29.0%).