Bay City: Fire Incidents, Texas (TX)
Where are fire incidents reported in Bay City, TX
Something went wrong! Please refresh the page.
|
| |||||||||||||||||||||||||||||||||||||||||||||||||||||||||||||||||||||||||||||||||||||||||||||||||||||||||||||
2004 - 2018 National Fire Incident Reporting System (NFIRS) incidents
- Incident types reported to NFIRS in Bay City, TX
- 52047.3%Fire
- 34831.6%Hazardous Condition
- 17015.5%Good Intent Call
- 232.1%Service Call
- 201.8%Rescue & EMS
- 171.5%False Alarm
- 20.2%Severe Weather
- Fire incident types reported to NFIRS in Bay City, TX
- 24747.5%Outside Fires
- 17934.4%Structure Fires
- 8917.1%Mobile Property/Vehicle Fires
- 51.0%Other
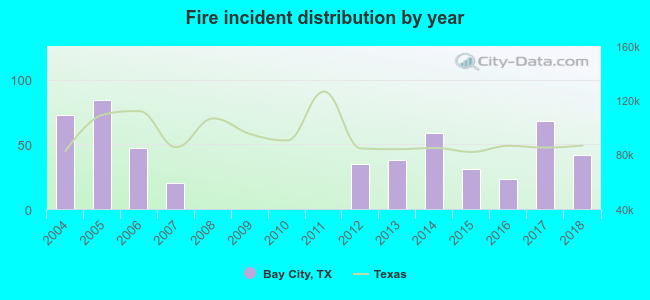 Based on the data from the years 2004 - 2018 the average number of fire incidents per year is 35. The highest number of fires - 84 took place in 2005, and the least - 0 in 2008. The data has a decreasing trend.
The average number of yearly fire incidents per 10k residents in Bay City, TX compared to nearest cities:
(Note: Based on data for the last 3 years, including only cities with population 5,000 and above)
| Bay City: | 25.5 |
| El Campo: | 78.3 |
| Wharton: | 32.3 |
| Lake Jackson: | 14.7 |
| Clute: | 2.6 |
| Angleton: | 68.0 |
| Freeport: | 45.7 |
| Rosenberg: | 59.4 |
| Edna: | 127.8 |
 The median response time based on all reported fire incidents is 7 minutes. This is similar to the Texas median value.
The median response time in Bay City, TX compared to nearest cities:
(Note: Based on data for all years, including only cities with at least 500 fire incidents)
| Bay City: | 7 minutes |
| El Campo: | 5 minutes |
| Brazoria: | 8 minutes |
| Wharton: | 6 minutes |
| Lake Jackson: | 9 minutes |
| Clute: | 6 minutes |
| Angleton: | 5 minutes |
| Beasley: | 10 minutes |
| Freeport: | 7 minutes |
 27.3% incidents where reported in the morning and 72.7% in the evening. The most fires (15.2%) took place on Tuesday, and the least (12.9%) on Sunday.
 According to the 520 fire incident reports from years 2004 - 2018 most fires (11.7%) took place during February, and the least (4.2%) in December.
 Out of all 1,100 cases reported during the years 2004 - 2018, the most belonged to the categories: Fire (47.3%), Rescue & EMS (31.6%), and Service Call (15.5%).
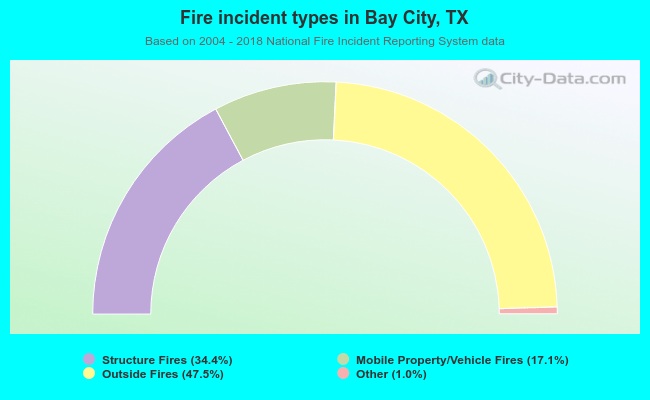 When looking into fire subcategories, the most incidents belonged to: Outside Fires (47.5%), and Structure Fires (34.4%).