Bay St. Louis: Fire Incidents, Mississippi (MS)
Where are fire incidents reported in Bay St. Louis, MS
Something went wrong! Please refresh the page.
|
| |||||||||||||||||||||||||||||||||||||||||||||||||||||||||||||||||||||||||||||||||||||||||||||||||||||||||||||
| Other | 190 | |||||||||||||||||||||||||||||||||||||||||||||||||||||||||||||||||||||||||||||||||||||||||||||||||||||||||||||
2002 - 2011 National Fire Incident Reporting System (NFIRS) incidents
- Incident types reported to NFIRS in Bay St. Louis, MS
- 52537.5%Rescue & EMS
- 51636.9%Fire
- 15611.1%Hazardous Condition
- 1017.2%Service Call
- 715.1%False Alarm
- 231.6%Good Intent Call
- 40.3%Special Incident
- 30.2%Overpressure Rupture
- Fire incident types reported to NFIRS in Bay St. Louis, MS
- 27453.1%Outside Fires
- 14127.3%Structure Fires
- 6212.0%Mobile Property/Vehicle Fires
- 397.6%Other
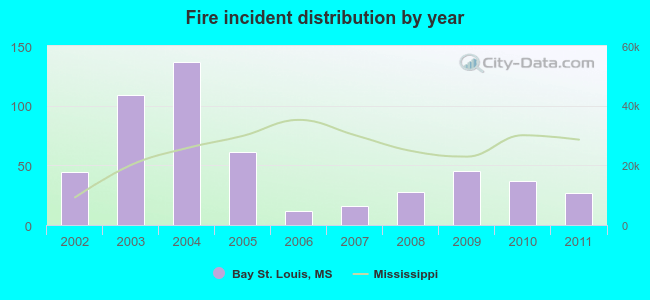 Based on the data from the years 2002 - 2011 the average number of fire incidents per year is 52. The highest number of reported fire incidents - 137 took place in 2004, and the least - 12 in 2006. The data has a declining trend.
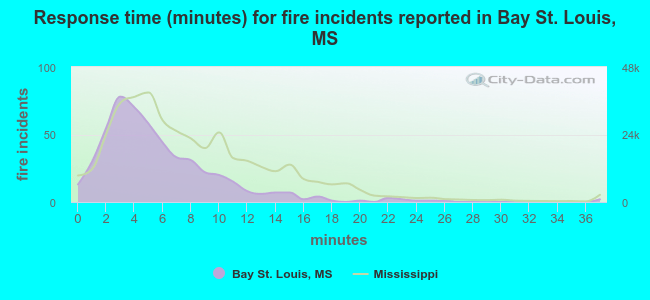 The median response time based on all reported fire incidents is 5 minutes. This is lower compared to the state median value.
The median response time in Bay St. Louis, MS compared to nearest cities:
(Note: Based on data for all years, including only cities with at least 500 fire incidents)
| Bay St. Louis: | 5 minutes |
| Waveland: | 4 minutes |
| Pass Christian: | 6 minutes |
| Kiln: | 10 minutes |
| Long Beach: | 5 minutes |
| Gulfport: | 5 minutes |
| Pearl River: | 8 minutes |
| Saucier: | 8 minutes |
| Picayune: | 4 minutes |
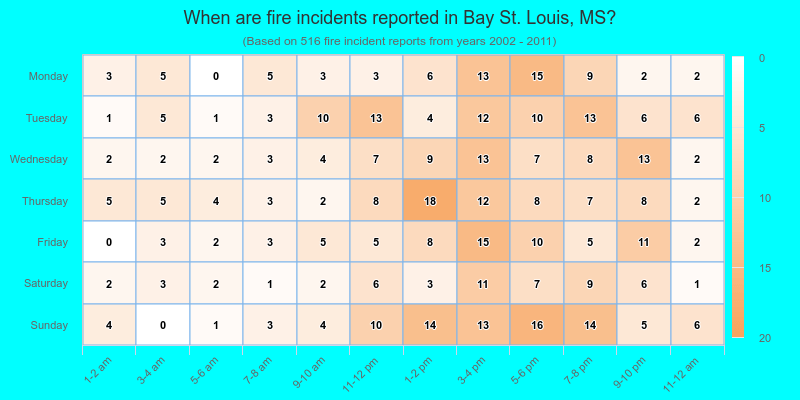
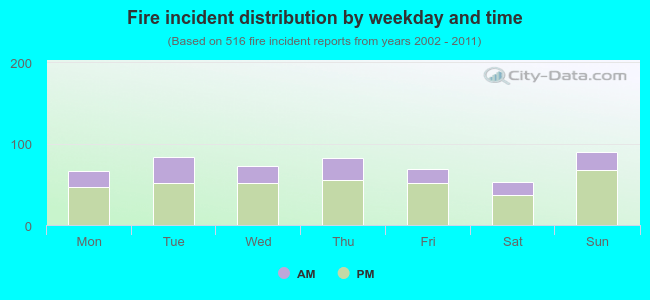 30.0% incidents where reported in the morning and 70.0% in the evening. The most fires (17.4%) took place on Sunday, and the least (10.3%) on Saturday.
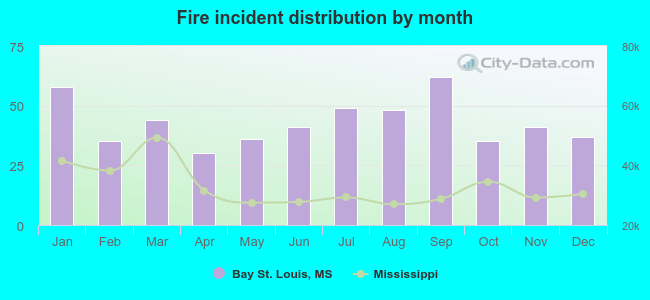 Based on the 516 fires from years 2002 - 2011 most fires (12.0%) took place during September, and the least (5.8%) in April.
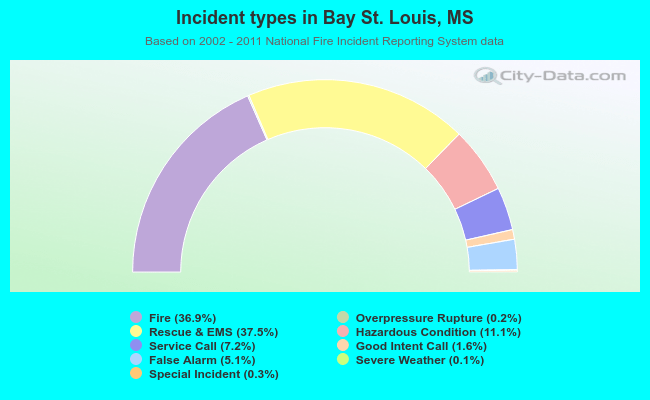 Out of all 1,400 cases reported during the years 2002 - 2011, the most belonged to the categories: Rescue & EMS (37.5%), Fire (36.9%), and Hazardous Condition (11.1%).
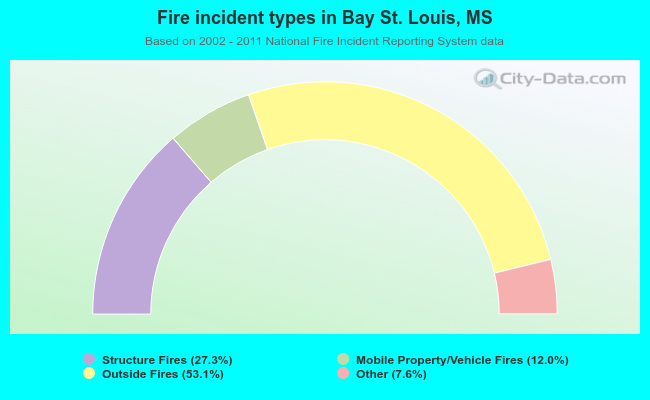 When looking into fire subcategories, the most reports belonged to: Outside Fires (53.1%), and Structure Fires (27.3%).