Beachwood: Fire Incidents, New Jersey (NJ)
Where are fire incidents reported in Beachwood, NJ
Something went wrong! Please refresh the page.
| Fire incidents reported | |
|---|---|
| Sreet name | Count |
| BERKELEY AVE | 68 |
| BEACHWOOD BLVD | 50 |
| GARDEN STATE PKY | 48 |
| LONGBOAT AVE | 46 |
| MERMAID AVE | 44 |
| MIZZEN AVE | 44 |
| SHIP AVE | 40 |
| SPAR AVE | 38 |
| NEPTUNE AVE | 36 |
| ATLANTIC CITY BLVD | 34 |
| GARDEN STATE PARKWAY | 32 |
| PACIFIC AVE | 30 |
| ANCHOR AVE | 28 |
| COMPASS AVE | 28 |
| OCEAN AVE | 28 |
| WINDWARD AVE | 28 |
| ENSIGN AVE | 26 |
| FORECASTLE AVE | 26 |
| FOREPEAK AVE | 24 |
| SPRAY AVE | 24 |
| TILLER AVE | 24 |
| CAPSTAN AVE | 22 |
| SEAMAN AVE | 22 |
| HALLIARD AVE | 20 |
| LOCKER ST | 20 |
| ROUTE 166 | 20 |
| LEEWARD AVE | 16 |
| PINEWALD RD | 16 |
| BOWLINE ST | 14 |
| GSP | 12 |
2002 - 2018 National Fire Incident Reporting System (NFIRS) incidents
- Incident types reported to NFIRS in Beachwood, NJ
- 1,07844.5%Hazardous Condition
- 68328.2%Fire
- 31513.0%False Alarm
- 1325.5%Service Call
- 1255.2%Good Intent Call
- 743.1%Rescue & EMS
- 90.4%Severe Weather
- 30.1%Special Incident
- Fire incident types reported to NFIRS in Beachwood, NJ
- 28842.2%Structure Fires
- 25036.6%Outside Fires
- 9513.9%Mobile Property/Vehicle Fires
- 507.3%Other
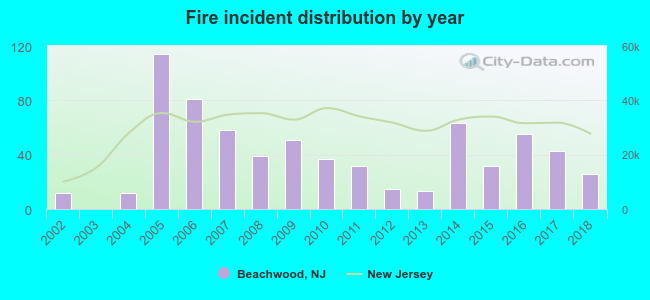 According to the data from the years 2002 - 2018 the average number of fire incidents per year is 40. The highest number of fires - 114 took place in 2005, and the least - 0 in 2003. The data has an increasing trend.
The average number of yearly fire incidents per 10k residents in Beachwood, NJ compared to nearest cities:
(Note: Based on data for the last 3 years, including only cities with population 5,000 and above)
| Beachwood: | 36.7 |
| Toms River: | 21.6 |
| Forked River: | 125.2 |
| Lakewood: | 1.7 |
| Point Pleasant: | 5.9 |
| Manasquan: | 64.2 |
| Belmar: | 23.9 |
| Browns Mills: | 65.3 |
| Asbury Park: | 53.2 |
 The median response time based on all reported fire incidents is 4 minutes. This is lower compared to the New Jersey median value.
The median response time in Beachwood, NJ compared to nearest cities:
(Note: Based on data for all years, including only cities with at least 500 fire incidents)
| Beachwood: | 4 minutes |
| Toms River: | 6 minutes |
| Forked River: | 5 minutes |
| Lakewood: | 4 minutes |
| Barnegat: | 5 minutes |
| Manasquan: | 5 minutes |
| Manahawkin: | 4 minutes |
| Browns Mills: | 7 minutes |
| Asbury Park: | 3 minutes |
 According to the reports from the years 2002 - 2018 the average number of fire-related yearly casualties is 0. The highest number of injuries - 3 took place in 2017, and the lowest - 0 in 2003. The data has a decreasing trend.
The average number of injuries per 1,000 fire incidents is 13. This indicator was the highest - 83 in 2002, and the lowest 0 in 2003. The trend for injuries per 1,000 fires is dropping. Compared to the state value the number of injuries per 1,000 fires is about the same.
According to the reports from the years 2002 - 2018 the average number of fire-related yearly casualties is 0. The highest number of injuries - 3 took place in 2017, and the lowest - 0 in 2003. The data has a decreasing trend.
The average number of injuries per 1,000 fire incidents is 13. This indicator was the highest - 83 in 2002, and the lowest 0 in 2003. The trend for injuries per 1,000 fires is dropping. Compared to the state value the number of injuries per 1,000 fires is about the same.Casualties per 1,000 incidents in Beachwood, NJ compared to nearest cities:
(Note: Based on data for all years, including only cities with at least 500 fire incidents)
| Beachwood: | 10.2 |
| Toms River: | 10.0 |
| Forked River: | 9.1 |
| Lakewood: | 44.4 |
| Barnegat: | 0.0 |
| Manasquan: | 7.1 |
| Manahawkin: | 10.8 |
| Browns Mills: | 17.1 |
| Asbury Park: | 11.6 |
 28.0% incidents where reported in the morning and 72.0% in the evening. The most fires (17.4%) took place on Friday, and the least (11.1%) on Wednesday.
 According to the 683 fire incidents from years 2002 - 2018 most fires (13.2%) took place during April, and the least (5.7%) in February.
 Out of all 2,420 cases reported during the years 2002 - 2018, the most belonged to the categories: Hazardous Condition (44.5%), Fire (28.2%), and False Alarm (13.0%).
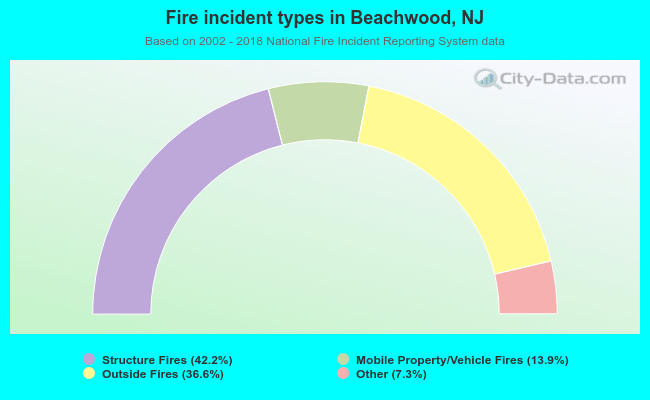 When looking into fire subcategories, the most reports belonged to: Structure Fires (42.2%), and Outside Fires (36.6%).