Berryville: Fire Incidents, Arkansas (AR)
Where are fire incidents reported in Berryville, AR
Something went wrong! Please refresh the page.
|
| |||||||||||||||||||||||||||||||||||||||||||||||||||||||||||||||||||||||||||||||||||||||||||||||||||||||||||||
| Other | 346 | |||||||||||||||||||||||||||||||||||||||||||||||||||||||||||||||||||||||||||||||||||||||||||||||||||||||||||||
2002 - 2018 National Fire Incident Reporting System (NFIRS) incidents
- Incident types reported to NFIRS in Berryville, AR
- 72647.3%Fire
- 25816.8%Rescue & EMS
- 24716.1%Good Intent Call
- 16710.9%Hazardous Condition
- 664.3%False Alarm
- 654.2%Service Call
- 50.3%Overpressure Rupture
- Fire incident types reported to NFIRS in Berryville, AR
- 40956.3%Outside Fires
- 19627.0%Structure Fires
- 10514.5%Mobile Property/Vehicle Fires
- 162.2%Other
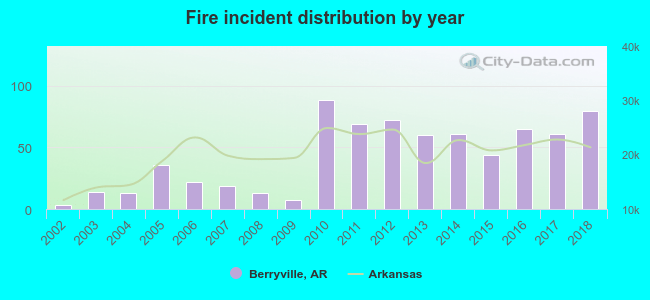 According to the data from the years 2002 - 2018 the average number of fire incidents per year is 43. The highest number of reported fires - 88 took place in 2010, and the least - 3 in 2002. The data has a growing trend.
The average number of yearly fire incidents per 10k residents in Berryville, AR compared to nearest cities:
(Note: Based on data for the last 3 years, including only cities with population 5,000 and above)
| Berryville: | 127.1 |
| Harrison: | 119.8 |
| Pea Ridge: | 27.4 |
| Rogers: | 34.1 |
| Lowell: | 81.2 |
| Springdale: | 34.6 |
| Bentonville: | 36.0 |
| Fayetteville: | 40.9 |
| Bella Vista: | 30.7 |
 The median response time based on all reported fire incidents is 9 minutes. This is higher than the Arkansas median value.
The median response time in Berryville, AR compared to nearest cities:
(Note: Based on data for all years, including only cities with at least 500 fire incidents)
| Berryville: | 9 minutes |
| Green Forest: | 11 minutes |
| Eureka Springs: | 8 minutes |
| Huntsville: | 11 minutes |
| Garfield: | 12 minutes |
| Harrison: | 6 minutes |
| Pea Ridge: | 9 minutes |
| Rogers: | 6 minutes |
| Lowell: | 5 minutes |
 According to the data from the years 2002 - 2018 the average number of fire-related yearly deaths is 0. The highest number of reported deaths - 4 took place in 2013, and the lowest - 0 in 2002. The data has a rising trend.
 26.4% incidents where reported in the morning and 73.6% in the evening. The most fires (16.4%) took place on Saturday, and the least (11.6%) on Tuesday.
 According to the 726 fire incident reports from years 2002 - 2018 most fires (14.2%) took place during January, and the least (4.1%) in May.
 Out of all 1,535 cases reported during the years 2002 - 2018, the most belonged to the categories: Fire (47.3%), Rescue & EMS (16.8%), and Good Intent Call (16.1%).
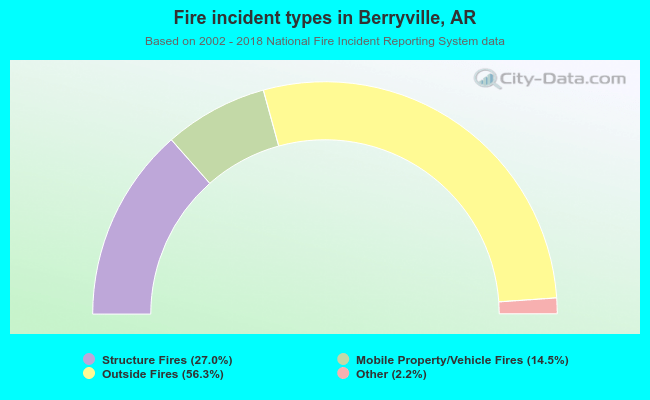 When looking into fire subcategories, the most reports belonged to: Outside Fires (56.3%), and Structure Fires (27.0%).