Black Diamond: Fire Incidents, Washington (WA)
Where are fire incidents reported in Black Diamond, WA
Something went wrong! Please refresh the page.
|
| |||||||||||||||||||||||||||||||||||||||||||||||||||||||||||||||||||||||||||||||||||||||||||||||||||||||||||||
2002 - 2018 National Fire Incident Reporting System (NFIRS) incidents
- Incident types reported to NFIRS in Black Diamond, WA
- 53538.1%Rescue & EMS
- 30421.6%Fire
- 22015.7%Hazardous Condition
- 18713.3%Service Call
- 1128.0%Good Intent Call
- 412.9%False Alarm
- 40.3%Overpressure Rupture
- 20.1%Severe Weather
- Fire incident types reported to NFIRS in Black Diamond, WA
- 15350.3%Outside Fires
- 11036.2%Structure Fires
- 3712.2%Mobile Property/Vehicle Fires
- 41.3%Other
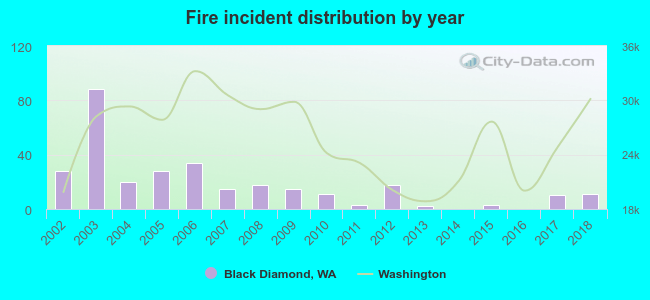 According to the data from the years 2002 - 2018 the average number of fires per year is 18. The highest number of fire incidents - 88 took place in 2003, and the least - 0 in 2014. The data has a decreasing trend.
 24.3% incidents where reported in the morning and 75.7% in the evening. The most fires (18.1%) took place on Wednesday, and the least (10.5%) on Tuesday.
 According to the 304 fire incident reports from years 2002 - 2018 most fires (14.8%) took place during July, and the least (4.3%) in October.
 Out of all 1,405 cases reported during the years 2002 - 2018, the most belonged to the categories: Rescue & EMS (38.1%), Fire (21.6%), and Hazardous Condition (15.7%).
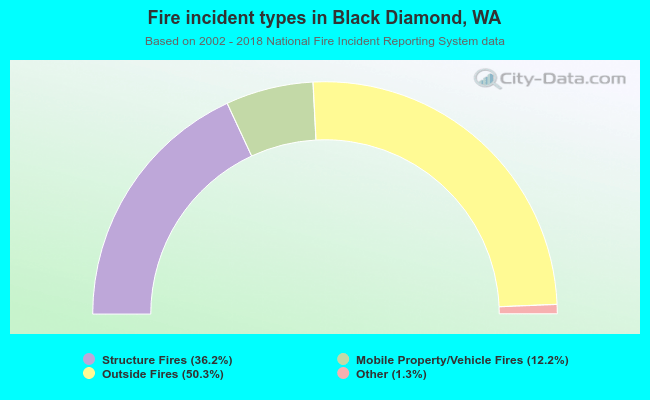 When looking into fire subcategories, the most incidents belonged to: Outside Fires (50.3%), and Structure Fires (36.2%).