Bowie: Fire Incidents, Maryland (MD)
Where are fire incidents reported in Bowie, MD
Something went wrong! Please refresh the page.
| Fire incidents reported | |
|---|---|
| Sreet name | Count |
| ANNAPOLIS RD | 46 |
| CRAIN HWY | 44 |
| MITCHELLVILLE RD | 42 |
| RACE TRACK RD | 42 |
| CHURCH RD | 40 |
| LAUREL BOWIE RD | 40 |
| CRAIN HY | 36 |
| CENTRAL AVE | 30 |
| GOVERNORS BRIDGE RD | 30 |
| EMERALD WAY | 24 |
| JOHN HANSON HY EB | 24 |
| JOHN HANSON HY WB | 24 |
| HIGH BRIDGE RD | 22 |
| JERICHO PARK | 22 |
| TOWN CENTER BLVD | 22 |
| WB JOHN HANSON HWY | 22 |
| EXCALIBUR RD | 20 |
| LONDON LN | 20 |
| NB CRAIN HWY | 20 |
| NORTHVIEW DR | 20 |
| CHELMONT LN | 18 |
| COLLINGTON RD | 18 |
| NORMAL SCHOOL RD | 18 |
| ELDER OAKS BL | 16 |
| EVERGLADE LN | 16 |
| HEALTH CENTER DR | 16 |
| EB JOHN HANSON HWY | 14 |
| FELTER LN | 14 |
| MAJOR LANSDALE BLVD | 14 |
| QUEEN ANNE BRIDGE RD | 12 |
| Other | 434 |
2008 - 2018 National Fire Incident Reporting System (NFIRS) incidents
- Incident types reported to NFIRS in Bowie, MD
- 7,52063.8%Rescue & EMS
- 1,18010.0%Fire
- 1,0078.5%Good Intent Call
- 9047.7%Hazardous Condition
- 6575.6%False Alarm
- 4874.1%Service Call
- 120.1%Special Incident
- Fire incident types reported to NFIRS in Bowie, MD
- 50943.1%Structure Fires
- 24120.4%Outside Fires
- 21818.5%Mobile Property/Vehicle Fires
- 21218.0%Other
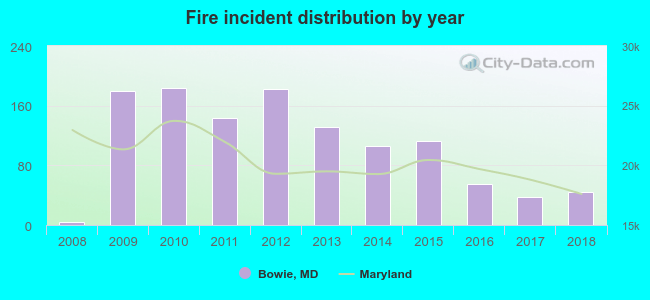 According to the data from the years 2008 - 2018 the average number of fire incidents per year is 107. The highest number of fire incidents - 184 took place in 2010, and the least - 4 in 2008. The data has a rising trend.
The average number of yearly fire incidents per 10k residents in Bowie, MD compared to nearest cities:
(Note: Based on data for the last 3 years, including only cities with population 5,000 and above)
| Bowie: | 7.9 |
| Glenn Dale: | 1.0 |
| Crofton: | 14.3 |
| Lanham: | 14.1 |
| Odenton: | 13.0 |
| Greenbelt: | 3.5 |
| Landover: | 3.2 |
| Fort Meade: | 1.8 |
| Maryland City: | 5.2 |
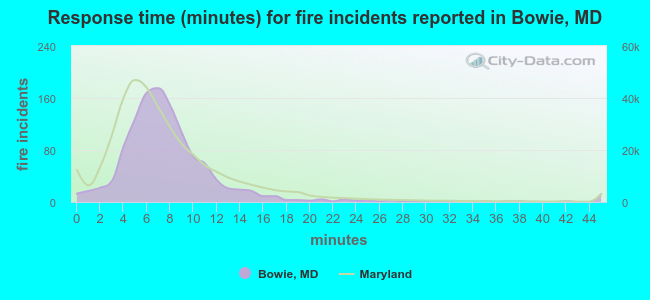 The median response time based on all reported fire incidents is 7 minutes. This is about the same as the state median value.
The median response time in Bowie, MD compared to nearest cities:
(Note: Based on data for all years, including only cities with at least 500 fire incidents)
| Bowie: | 7 minutes |
| Lanham: | 7 minutes |
| Largo: | 7 minutes |
| Odenton: | 7 minutes |
| Landover: | 5 minutes |
| Bladensburg: | 5 minutes |
| Upper Marlboro: | 9 minutes |
| Beltsville: | 6 minutes |
| Laurel: | 7 minutes |
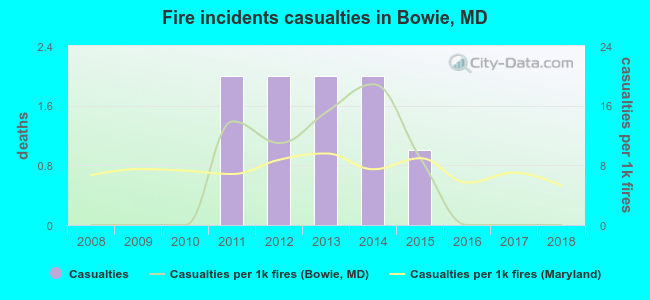 According to the reports from the years 2008 - 2018 the average number of fire-related casualties per year is 1. The highest number of casualties - 2 took place in 2011, and the lowest - 0 in 2008. The data has a constant trend.
The average number of casualties per 1,000 fires is 6. This indicator was the highest - 19 in 2014, and the lowest 0 in 2008. The trend for injuries per 1,000 fire incidents is constant. Compared to the state value the number of injuries per 1,000 incidents is about the same.
According to the reports from the years 2008 - 2018 the average number of fire-related casualties per year is 1. The highest number of casualties - 2 took place in 2011, and the lowest - 0 in 2008. The data has a constant trend.
The average number of casualties per 1,000 fires is 6. This indicator was the highest - 19 in 2014, and the lowest 0 in 2008. The trend for injuries per 1,000 fire incidents is constant. Compared to the state value the number of injuries per 1,000 incidents is about the same.Casualties per 1,000 incidents in Bowie, MD compared to nearest cities:
(Note: Based on data for all years, including only cities with at least 500 fire incidents)
| Bowie: | 7.6 |
| Lanham: | 14.8 |
| Largo: | 7.6 |
| Odenton: | 5.1 |
| Landover: | 7.1 |
| Bladensburg: | 16.8 |
| Upper Marlboro: | 3.1 |
| Beltsville: | 10.0 |
| Laurel: | 14.5 |
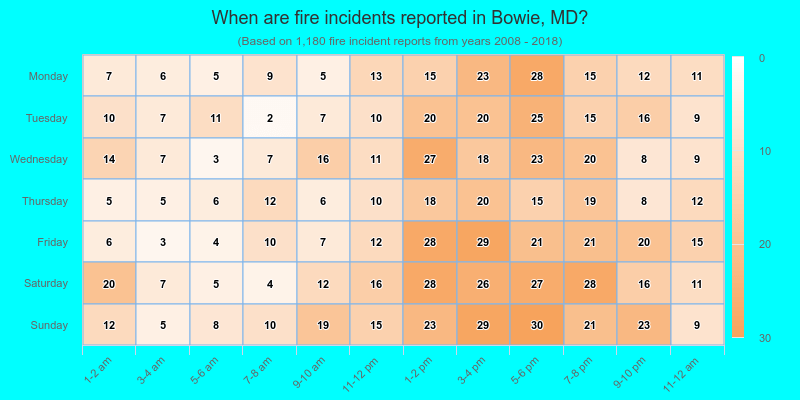
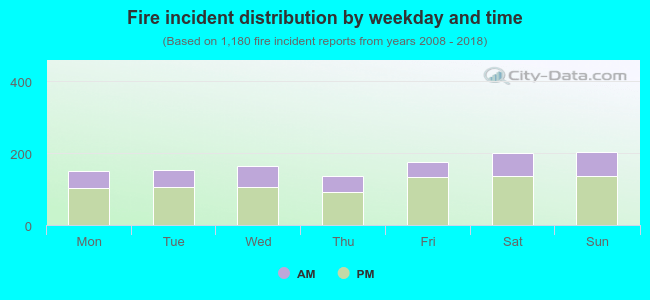 31.3% incidents where reported in the morning and 68.7% in the evening. The most fires (17.3%) took place on Sunday, and the least (11.5%) on Thursday.
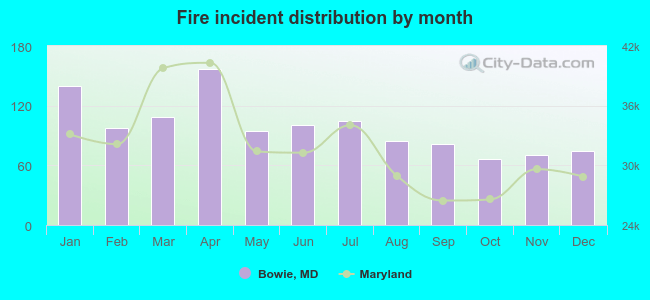 Based on the 1,180 incident reports from years 2008 - 2018 most fires (13.3%) took place during April, and the least (5.6%) in October.
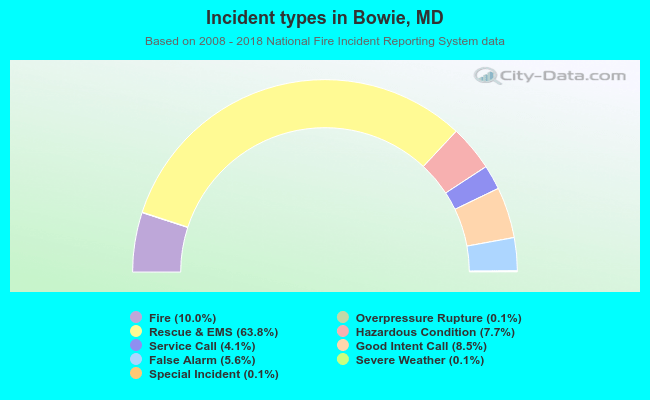 Out of all 11,780 cases reported during the years 2008 - 2018, the most belonged to the categories: Rescue & EMS (63.8%), Fire (10.0%), and Good Intent Call (8.5%).
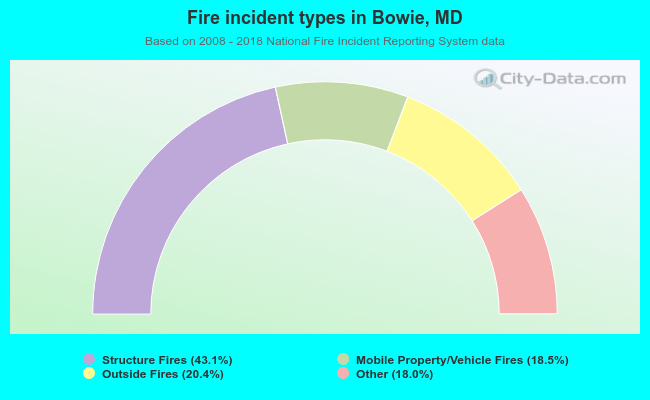 When looking into fire subcategories, the most reports belonged to: Structure Fires (43.1%), and Outside Fires (20.4%).