Brielle: Fire Incidents, New Jersey (NJ)
Where are fire incidents reported in Brielle, NJ
Something went wrong! Please refresh the page.
|
| |||||||||||||||||||||||||||||||||||||||||||||||||||||||||||||||||||||||||||||||||||||||||||||||||||||||||||||
2005 - 2018 National Fire Incident Reporting System (NFIRS) incidents
- Incident types reported to NFIRS in Brielle, NJ
- 58454.0%Hazardous Condition
- 22120.4%False Alarm
- 14813.7%Fire
- 635.8%Good Intent Call
- 434.0%Service Call
- 151.4%Rescue & EMS
- 60.6%Severe Weather
- Fire incident types reported to NFIRS in Brielle, NJ
- 6946.6%Structure Fires
- 4027.0%Outside Fires
- 2718.2%Mobile Property/Vehicle Fires
- 128.1%Other
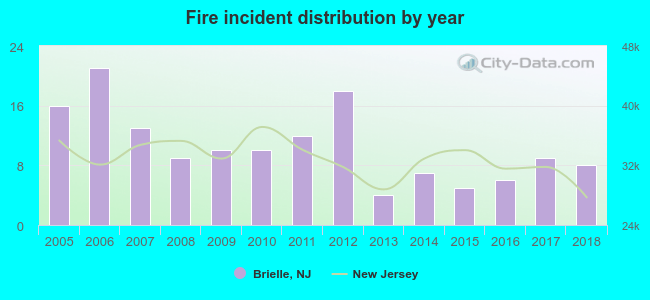 Based on the data from the years 2005 - 2018 the average number of fire incidents per year is 11. The highest number of reported fire incidents - 21 took place in 2006, and the least - 4 in 2013. The data has a decreasing trend.
 Based on the data from the years 2005 - 2018 the average number of fire-related casualties per year is 0. The highest number of reported injuries - 2 took place in 2006, and the lowest - 0 in 2005. The data has a constant trend.
 31.8% incidents where reported in the morning and 68.2% in the evening. The most fires (16.9%) took place on Wednesday, and the least (11.5%) on Monday.
 According to the 148 fire incident reports from years 2005 - 2018 most fires (14.9%) took place during June, and the least (4.1%) in February.
 Out of all 1,082 cases reported during the years 2005 - 2018, the most belonged to the categories: Hazardous Condition (54.0%), False Alarm (20.4%), and Fire (13.7%).
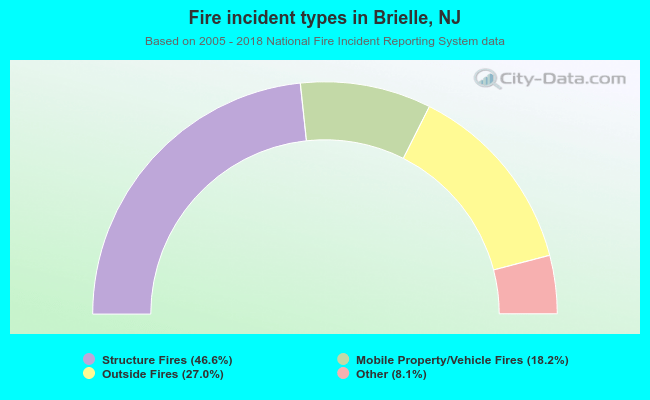 When looking into fire subcategories, the most incidents belonged to: Structure Fires (46.6%), and Outside Fires (27.0%).