Brockton: Fire Incidents, Massachusetts (MA)
Where are fire incidents reported in Brockton, MA
Something went wrong! Please refresh the page.
| Fire incidents reported | |
|---|---|
| Sreet name | Count |
| MAIN ST | 772 |
| CRESCENT ST | 418 |
| BELMONT ST | 402 |
| PLEASANT ST | 282 |
| CENTRE ST | 240 |
| OAK ST | 212 |
| MONTELLO ST | 208 |
| N MAIN ST | 184 |
| HAVERHILL ST | 178 |
| NORTH MAIN ST | 176 |
| WESTGATE DR | 170 |
| WARREN AVE | 158 |
| COLONEL BELL DR | 140 |
| HIGHLAND ST | 120 |
| N MONTELLO ST | 114 |
| SUMMER ST | 110 |
| BELAIR ST | 108 |
| GODDARD RD | 108 |
| HILL ST | 108 |
| WESTLAND ST | 102 |
| COURT ST | 92 |
| NORTH MONTELLO ST | 88 |
| ASH ST | 84 |
| FOREST AVE | 84 |
| AMES ST | 74 |
| NEWBURY ST | 72 |
| OAK LN | 72 |
| TORREY ST | 72 |
| SPRING ST | 70 |
| CARL AVE | 66 |
| Other | 1,368 |
2002 - 2018 National Fire Incident Reporting System (NFIRS) incidents
- Incident types reported to NFIRS in Brockton, MA
- 74,00170.7%Rescue & EMS
- 9,6889.3%False Alarm
- 6,4526.2%Fire
- 6,1205.8%Service Call
- 4,7254.5%Hazardous Condition
- 3,4993.3%Good Intent Call
- Fire incident types reported to NFIRS in Brockton, MA
- 3,56855.3%Structure Fires
- 1,68926.2%Outside Fires
- 87413.5%Mobile Property/Vehicle Fires
- 3215.0%Other
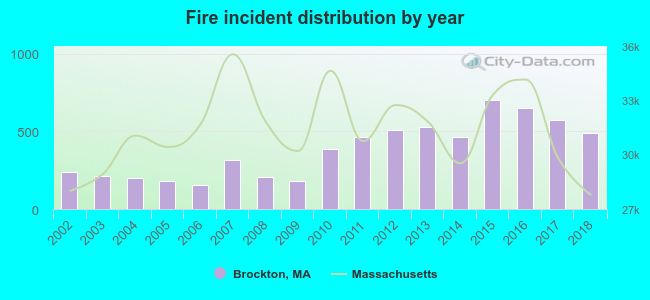 Based on the data from the years 2002 - 2018 the average number of fire incidents per year is 380. The highest number of fire incidents - 701 took place in 2015, and the least - 153 in 2006. The data has a rising trend.
The average number of yearly fire incidents per 10k residents in Brockton, MA compared to nearest cities:
(Note: Based on data for the last 3 years, including only cities with population 5,000 and above)
| Brockton: | 60.2 |
| West Bridgewater: | 57.4 |
| Whitman: | 19.8 |
| Abington: | 34.0 |
| Holbrook: | 47.3 |
| Easton: | 23.4 |
| Stoughton: | 44.3 |
| East Bridgewater: | 25.9 |
| Randolph: | 60.2 |
 The median response time based on all reported fire incidents is 4 minutes. This is similar to the state median value.
The median response time in Brockton, MA compared to nearest cities:
(Note: Based on data for all years, including only cities with at least 500 fire incidents)
| Brockton: | 4 minutes |
| Avon: | 4 minutes |
| West Bridgewater: | 4 minutes |
| Whitman: | 2 minutes |
| Abington: | 4 minutes |
| Holbrook: | 3 minutes |
| Easton: | 5 minutes |
| Stoughton: | 3 minutes |
| East Bridgewater: | 5 minutes |
 According to the data from the years 2002 - 2018 the average number of fire-related yearly deaths is 1. The highest number of reported deaths - 5 took place in 2006, and the lowest - 0 in 2002. The data has a constant trend.
The average number of fatalities per 1,000 fires is 5. This indicator was the highest - 33 in 2006, and the lowest 0 in 2002. The trend for fatalities per 1,000 fire incidents is decreasing. Compared to the state value the number of fatalities per 1,000 fire incidents is much higher.
According to the data from the years 2002 - 2018 the average number of fire-related yearly deaths is 1. The highest number of reported deaths - 5 took place in 2006, and the lowest - 0 in 2002. The data has a constant trend.
The average number of fatalities per 1,000 fires is 5. This indicator was the highest - 33 in 2006, and the lowest 0 in 2002. The trend for fatalities per 1,000 fire incidents is decreasing. Compared to the state value the number of fatalities per 1,000 fire incidents is much higher.
 Based on the data from the years 2002 - 2018 the average number of fire-related casualties per year is 13. The highest number of casualties - 25 took place in 2011, and the lowest - 6 in 2002. The data has a growing trend.
The average number of injuries per 1,000 fire incidents is 42. This indicator was the highest - 144 in 2006, and the lowest 15 in 2013. The trend for casualties per 1,000 fire incidents is growing. Compared to the state value the number of casualties per 1,000 fire incidents is much higher.
Based on the data from the years 2002 - 2018 the average number of fire-related casualties per year is 13. The highest number of casualties - 25 took place in 2011, and the lowest - 6 in 2002. The data has a growing trend.
The average number of injuries per 1,000 fire incidents is 42. This indicator was the highest - 144 in 2006, and the lowest 15 in 2013. The trend for casualties per 1,000 fire incidents is growing. Compared to the state value the number of casualties per 1,000 fire incidents is much higher.Casualties per 1,000 incidents in Brockton, MA compared to nearest cities:
(Note: Based on data for all years, including only cities with at least 500 fire incidents)
| Brockton: | 35.0 |
| Avon: | 14.6 |
| West Bridgewater: | 10.4 |
| Whitman: | 24.0 |
| Abington: | 15.5 |
| Holbrook: | 12.3 |
| Easton: | 49.1 |
| Stoughton: | 7.2 |
| East Bridgewater: | 17.7 |
 32.0% incidents where reported in the morning and 68.0% in the evening. The most fires (16.0%) took place on Sunday, and the least (12.8%) on Wednesday.
 Based on the 6,452 fire incident reports from years 2002 - 2018 most fires (10.3%) took place during April, and the least (6.4%) in February.
 Out of all 104,678 cases reported during the years 2002 - 2018, the most belonged to the categories: Rescue & EMS (70.7%), False Alarm (9.3%), and Fire (6.2%).
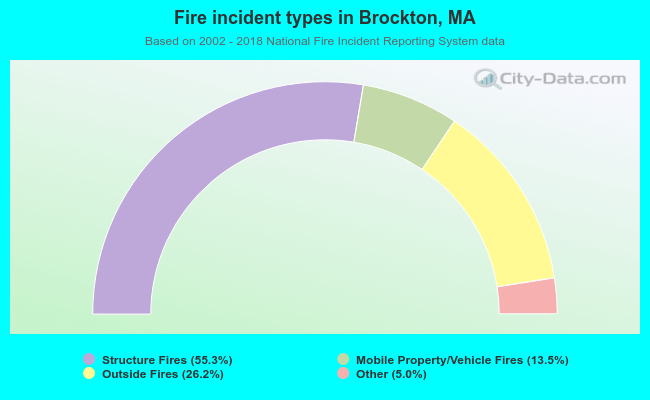 When looking into fire subcategories, the most reports belonged to: Structure Fires (55.3%), and Outside Fires (26.2%).