Buckeye: Fire Incidents, Arizona (AZ)
Where are fire incidents reported in Buckeye, AZ
Something went wrong! Please refresh the page.
| Fire incidents reported | |
|---|---|
| Sreet name | Count |
| I10 | 546 |
| MILLER RD | 122 |
| BROADWAY RD | 112 |
| APACHE RD | 100 |
| BELOAT RD | 92 |
| WATSON RD | 90 |
| BASELINE RD | 68 |
| MC85 | 66 |
| SR 85 | 62 |
| A85 | 54 |
| MONROE AV | 52 |
| 7TH ST | 42 |
| HAZEN RD | 40 |
| LOWER BUCKEYE RD | 40 |
| RAINBOW RD | 38 |
| JACKRABBIT TL | 30 |
| MCDOWELL RD | 30 |
| PIMA ST | 30 |
| 4TH ST | 28 |
| AIRPORT RD | 28 |
| 6TH ST | 24 |
| 9TH ST | 22 |
| YAVAPAI ST | 22 |
| CENTRE AV | 20 |
| DEAN RD | 20 |
| SONORA ST | 20 |
| DESERT BLOOM ST | 18 |
| 5TH ST | 16 |
| INDIAN SCHOOL RD | 16 |
| PAPAGO ST | 16 |
| Other | 238 |
2003 - 2018 National Fire Incident Reporting System (NFIRS) incidents
- Incident types reported to NFIRS in Buckeye, AZ
- 24,70378.0%Rescue & EMS
- 2,1026.6%Fire
- 1,7595.6%Service Call
- 1,3524.3%False Alarm
- 1,1413.6%Good Intent Call
- 5281.7%Hazardous Condition
- 570.2%Special Incident
- Fire incident types reported to NFIRS in Buckeye, AZ
- 99747.4%Outside Fires
- 50123.8%Structure Fires
- 40019.0%Mobile Property/Vehicle Fires
- 2049.7%Other
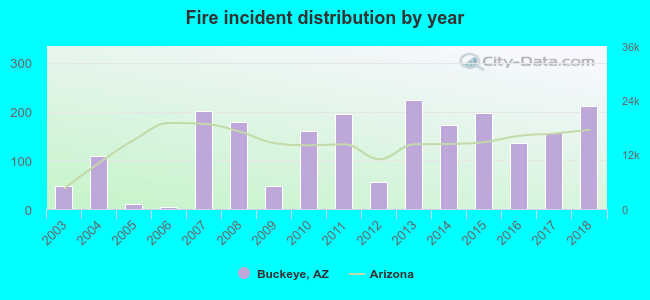 Based on the data from the years 2003 - 2018 the average number of fire incidents per year is 131. The highest number of fire incidents - 223 took place in 2013, and the least - 4 in 2006. The data has an increasing trend.
The average number of yearly fire incidents per 10k residents in Buckeye, AZ compared to nearest cities:
(Note: Based on data for the last 3 years, including only cities with population 5,000 and above)
| Buckeye: | 28.3 |
| Goodyear: | 18.8 |
| Litchfield Park: | 17.9 |
| Avondale: | 34.3 |
| Surprise: | 18.8 |
| El Mirage: | 32.0 |
| Tolleson: | 96.7 |
| Youngtown: | 53.5 |
| Sun City West: | 17.7 |
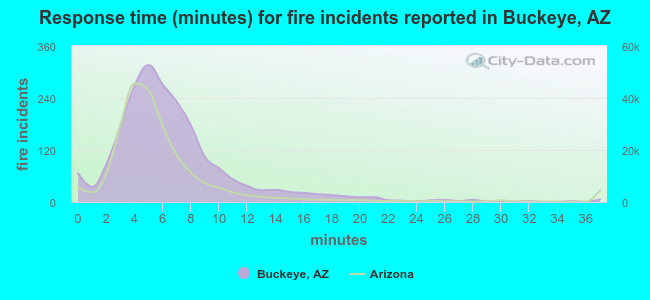 The median response time based on all reported fire incidents is 6 minutes. This is close to the state median value.
The median response time in Buckeye, AZ compared to nearest cities:
(Note: Based on data for all years, including only cities with at least 500 fire incidents)
| Buckeye: | 6 minutes |
| Goodyear: | 6 minutes |
| Avondale: | 5 minutes |
| Surprise: | 5 minutes |
| El Mirage: | 5 minutes |
| Tonopah: | 11 minutes |
| Sun City: | 4 minutes |
| Peoria: | 5 minutes |
| Glendale: | 4 minutes |
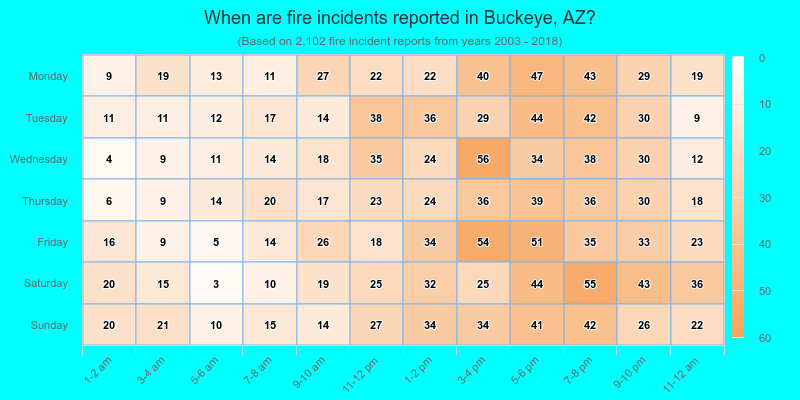
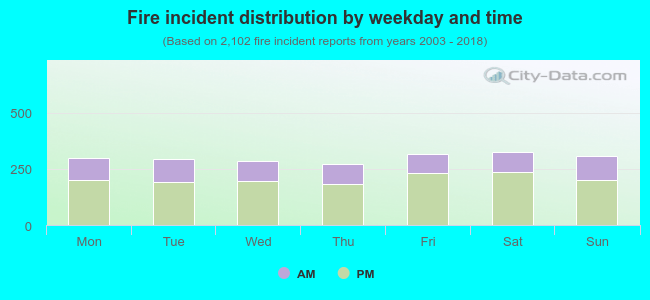 31.9% incidents where reported in the morning and 68.1% in the evening. The most fires (15.6%) took place on Saturday, and the least (12.9%) on Thursday.
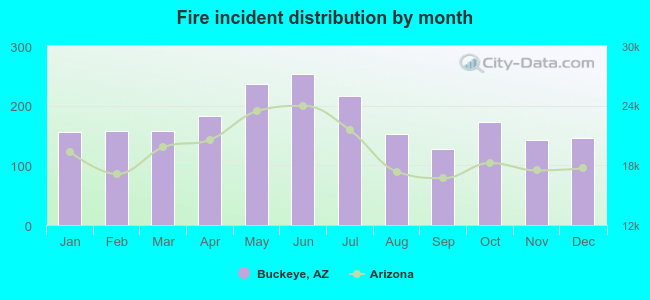 Based on the 2,102 fire incident reports from years 2003 - 2018 most fires (12.0%) took place during June, and the least (6.1%) in September.
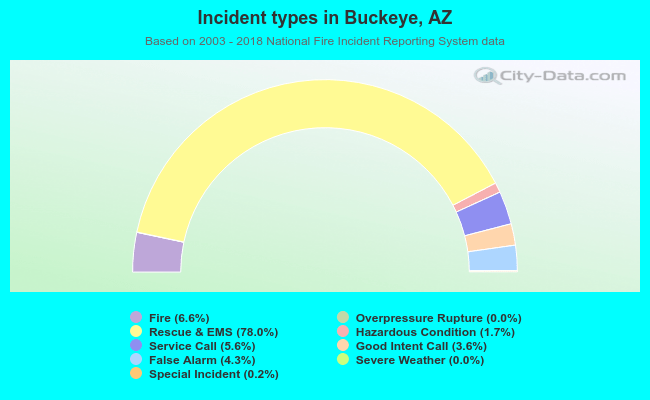 Out of all 31,653 cases reported during the years 2003 - 2018, the most belonged to the categories: Rescue & EMS (78.0%), Fire (6.6%), and Service Call (5.6%).
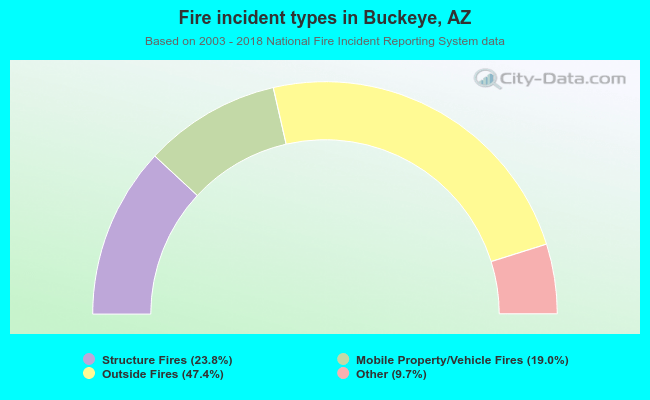 When looking into fire subcategories, the most reports belonged to: Outside Fires (47.4%), and Structure Fires (23.8%).