Buckner: Fire Incidents, Missouri (MO)
Where are fire incidents reported in Buckner, MO
Something went wrong! Please refresh the page.
|
| |||||||||||||||||||||||||||||||||||||||||||||||||||||||||||||||||||||||||||||||||||||||||||||||||||||||||||||
2002 - 2018 National Fire Incident Reporting System (NFIRS) incidents
- Incident types reported to NFIRS in Buckner, MO
- 1,64350.5%Rescue & EMS
- 59918.4%Service Call
- 40212.4%Hazardous Condition
- 39612.2%Fire
- 1213.7%Good Intent Call
- 812.5%False Alarm
- 70.2%Severe Weather
- Fire incident types reported to NFIRS in Buckner, MO
- 17945.2%Outside Fires
- 14436.4%Structure Fires
- 5614.1%Mobile Property/Vehicle Fires
- 174.3%Other
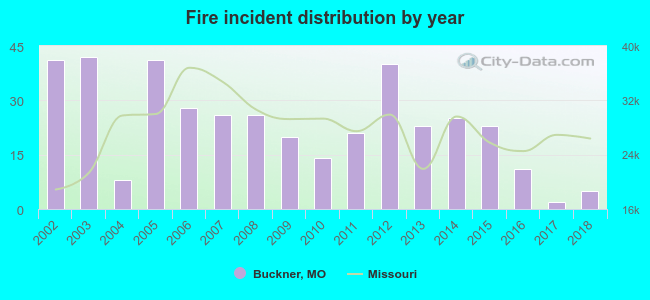 Based on the data from the years 2002 - 2018 the average number of fires per year is 23. The highest number of fires - 42 took place in 2003, and the least - 2 in 2017. The data has a declining trend.
 According to the data from the years 2002 - 2018 the average number of fire-related yearly casualties is 0. The highest number of reported casualties - 1 took place in 2010, and the lowest - 0 in 2002. The data has a constant trend.
 29.3% incidents where reported in the morning and 70.7% in the evening. The most fires (16.9%) took place on Friday, and the least (12.1%) on Thursday.
 Based on the 396 reports from years 2002 - 2018 most fires (12.4%) took place during March, and the least (5.3%) in October.
 Out of all 3,255 cases reported during the years 2002 - 2018, the most belonged to the categories: Rescue & EMS (50.5%), Service Call (18.4%), and Hazardous Condition (12.4%).
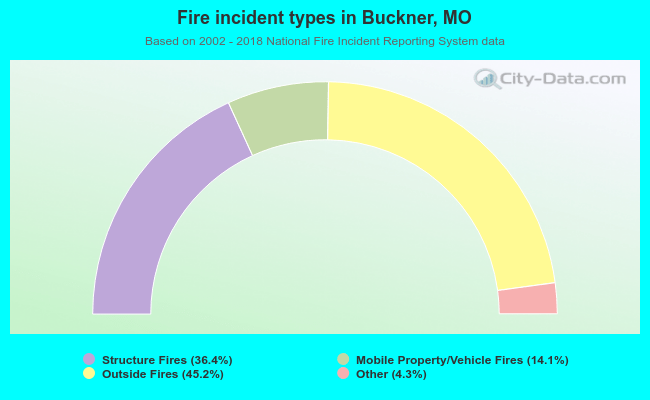 When looking into fire subcategories, the most incidents belonged to: Outside Fires (45.2%), and Structure Fires (36.4%).