Camas: Fire Incidents, Washington (WA)
Where are fire incidents reported in Camas, WA
Something went wrong! Please refresh the page.
| Fire incidents reported | |
|---|---|
| Sreet name | Count |
| 3RD AVE | 128 |
| 6TH AVE | 72 |
| EVERETT ST | 72 |
| ADAMS ST | 48 |
| 192ND AV | 40 |
| 8TH AVE | 38 |
| LEADBETTER RD | 38 |
| 7TH AVE | 36 |
| 22ND AVE | 32 |
| LAKE RD | 26 |
| UNION ST | 26 |
| 4TH AVE | 24 |
| 267TH AVE | 20 |
| 2ND AVE | 20 |
| 3RD ST | 20 |
| BOULDER CREEK RD | 20 |
| DIVISION ST | 18 |
| EVERETT RD | 18 |
| 10TH AVE | 16 |
| 15TH ST | 16 |
| 1ST AVE | 16 |
| 1ST ST | 16 |
| 283 AVE | 16 |
| 283RD AVE | 16 |
| 38TH AVE | 16 |
| 5TH AVE | 16 |
| BENTON ST | 16 |
| FARGO ST | 16 |
| FRANKLIN ST | 16 |
| NORWOOD ST | 16 |
| Other | 318 |
2002 - 2018 National Fire Incident Reporting System (NFIRS) incidents
- Incident types reported to NFIRS in Camas, WA
- 7,22563.4%Rescue & EMS
- 1,48113.0%Good Intent Call
- 1,20610.6%Fire
- 6255.5%Service Call
- 4644.1%Hazardous Condition
- 3543.1%False Alarm
- 250.2%Special Incident
- Fire incident types reported to NFIRS in Camas, WA
- 49240.8%Structure Fires
- 47839.6%Outside Fires
- 17114.2%Mobile Property/Vehicle Fires
- 655.4%Other
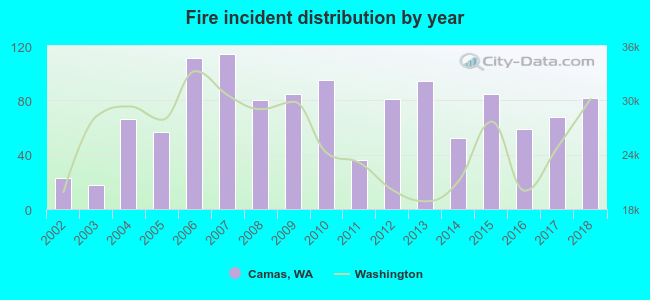 According to the data from the years 2002 - 2018 the average number of fires per year is 71. The highest number of fires - 114 took place in 2007, and the least - 18 in 2003. The data has an increasing trend.
The average number of yearly fire incidents per 10k residents in Camas, WA compared to nearest cities:
(Note: Based on data for the last 3 years, including only cities with population 5,000 and above)
| Camas: | 32.8 |
| Washougal: | 45.1 |
| Vancouver: | 40.5 |
| Hazel Dell: | 4.1 |
| Battle Ground: | 61.6 |
| Ridgefield: | 110.5 |
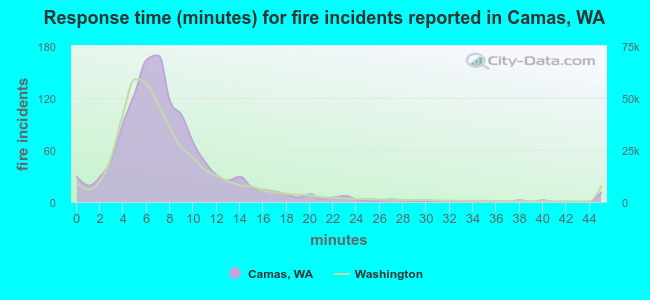 The median response time based on all reported fire incidents is 7 minutes. This is comparable to the state median value.
The median response time in Camas, WA compared to nearest cities:
(Note: Based on data for all years, including only cities with at least 500 fire incidents)
| Camas: | 7 minutes |
| Washougal: | 7 minutes |
| Troutdale: | 5 minutes |
| Gresham: | 5 minutes |
| Vancouver: | 6 minutes |
| Brush Prairie: | 7 minutes |
| Happy Valley: | 5 minutes |
| Portland: | 5 minutes |
| Milwaukie: | 5 minutes |
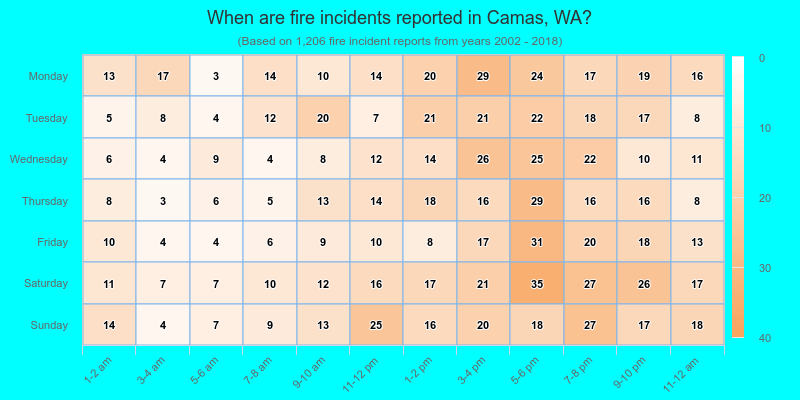
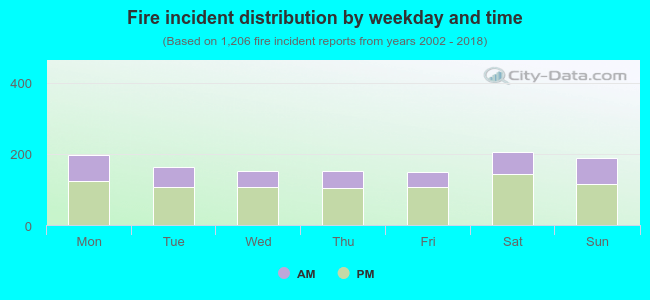 32.9% incidents where reported in the morning and 67.1% in the evening. The most fires (17.1%) took place on Saturday, and the least (12.4%) on Friday.
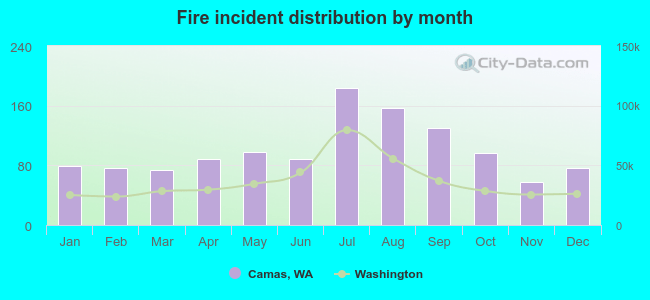 Based on the 1,206 fires from years 2002 - 2018 most fires (15.3%) took place during July, and the least (4.7%) in November.
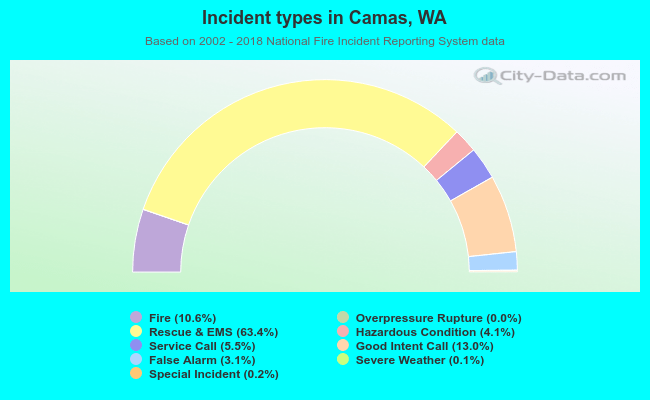 Out of all 11,387 cases reported during the years 2002 - 2018, the most belonged to the categories: Rescue & EMS (63.4%), Good Intent Call (13.0%), and Fire (10.6%).
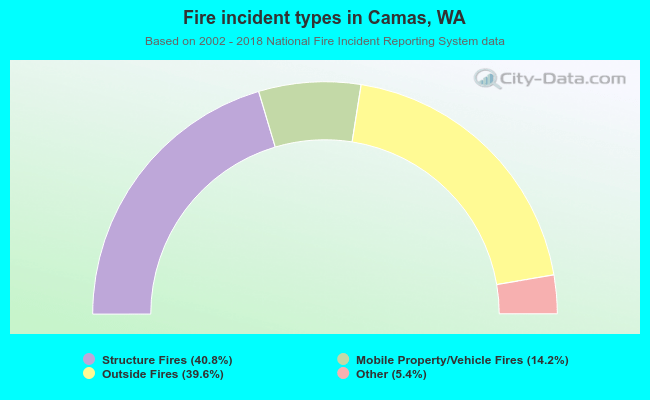 When looking into fire subcategories, the most reports belonged to: Structure Fires (40.8%), and Outside Fires (39.6%).