Carson: Fire Incidents, California (CA)
Where are fire incidents reported in Carson, CA
Something went wrong! Please refresh the page.
| Fire incidents reported | |
|---|---|
| Sreet name | Count |
| CARSON | 262 |
| MAIN | 220 |
| AVALON | 210 |
| FIGUEROA | 166 |
| 223RD | 122 |
| 220TH | 78 |
| DEL AMO | 76 |
| SEPULVEDA | 72 |
| WILMINGTON | 70 |
| VICTORIA | 56 |
| ALAMEDA | 52 |
| BROADWAY | 48 |
| SANTA FE | 44 |
| DOMINGUEZ | 40 |
| 219TH | 36 |
| GARDENA | 36 |
| CENTRAL | 32 |
| NB 110 AT SEPULVEDA | 32 |
| FWY | 30 |
| NB 110 SO SEPULVEDA | 30 |
| LOMITA | 28 |
| HELMICK | 26 |
| ALBERTONI | 24 |
| DOLORES | 24 |
| MONETA | 24 |
| 213TH | 22 |
| SB 110 NO SEPULVEDA | 22 |
| 192ND | 20 |
| 229TH | 20 |
| 234TH | 20 |
| Other | 29 |
2005 - 2018 National Fire Incident Reporting System (NFIRS) incidents
- Incident types reported to NFIRS in Carson, CA
- 26,33364.8%Rescue & EMS
- 7,35518.1%Good Intent Call
- 2,8457.0%False Alarm
- 1,9714.8%Fire
- 1,0862.7%Hazardous Condition
- 9772.4%Service Call
- 550.1%Special Incident
- Fire incident types reported to NFIRS in Carson, CA
- 69635.3%Outside Fires
- 62831.9%Mobile Property/Vehicle Fires
- 52126.4%Structure Fires
- 1266.4%Other
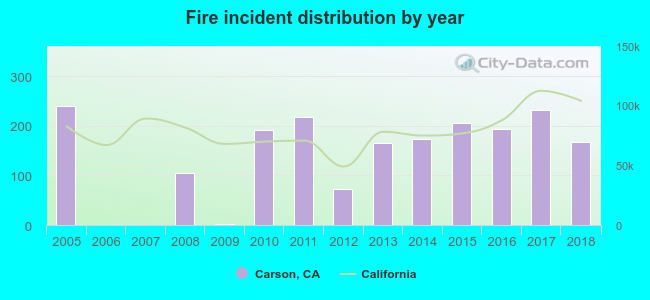 According to the data from the years 2005 - 2018 the average number of fire incidents per year is 141. The highest number of reported fires - 241 took place in 2005, and the least - 0 in 2006. The data has a dropping trend.
The average number of yearly fire incidents per 10k residents in Carson, CA compared to nearest cities:
(Note: Based on data for the last 3 years, including only cities with population 5,000 and above)
| Carson: | 21.2 |
| Compton: | 28.2 |
| Lomita: | 13.0 |
| Gardena: | 27.7 |
| Torrance: | 13.1 |
| Signal Hill: | 32.1 |
| Lawndale: | 14.3 |
| Long Beach: | 22.3 |
| Lynwood: | 19.4 |
 The median response time based on all reported fire incidents is 4 minutes. This is lower compared to the California median value.
The median response time in Carson, CA compared to nearest cities:
(Note: Based on data for all years, including only cities with at least 500 fire incidents)
| Carson: | 4 minutes |
| Compton: | 6 minutes |
| Gardena: | 5 minutes |
| Torrance: | 5 minutes |
| Long Beach: | 5 minutes |
| Lynwood: | 4 minutes |
| Paramount: | 5 minutes |
| Redondo Beach: | 5 minutes |
| Hawthorne: | 4 minutes |
 36.9% incidents where reported in the morning and 63.1% in the evening. The most fires (15.4%) took place on Thursday, and the least (13.4%) on Friday.
 Based on the 1,971 reports from years 2005 - 2018 most fires (10.0%) took place during July, and the least (6.8%) in December.
 Out of all 40,648 cases reported during the years 2005 - 2018, the most belonged to the categories: Rescue & EMS (64.8%), Good Intent Call (18.1%), and False Alarm (7.0%).
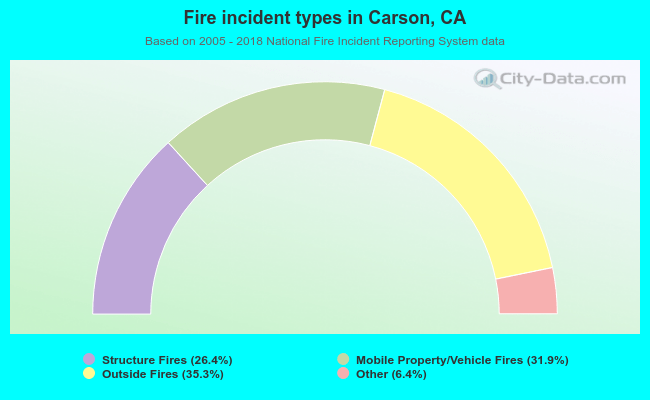 When looking into fire subcategories, the most incidents belonged to: Outside Fires (35.3%), and Mobile Property/Vehicle Fires (31.9%).