Cathedral City: Fire Incidents, California (CA)
Where are fire incidents reported in Cathedral City, CA
Something went wrong! Please refresh the page.
| Fire incidents reported | |
|---|---|
| Sreet name | Count |
| DATE PALM DR | 234 |
| RAMON RD | 212 |
| EAST PALM CANYON DR | 104 |
| LANDAU | 102 |
| CATHEDRAL CANYON DR | 74 |
| INTERSTATE | 62 |
| PEREZ RD | 54 |
| SKY BLUE WATER | 50 |
| DINAH SHORE DR | 38 |
| VISTA CHINO RD | 38 |
| BANKSIDE DR | 36 |
| AVENIDA MARAVILLA | 32 |
| EAST PALM CYN. DR | 32 |
| MISSION DR | 28 |
| VARNER RD | 28 |
| CORREGIDOR DR | 26 |
| DESERT VISTA RD | 26 |
| 33RD | 22 |
| AVENIDA LOS NINOS | 22 |
| PUEBLO | 22 |
| SHIFTING SANDS | 22 |
| 30TH | 20 |
| AURORA VISTA RD | 20 |
| AVENIDA LA GAVIOTA | 20 |
| CATHEDRAL CYN DR | 20 |
| SAN LUIS REY DR | 20 |
| WHISPERING PALMS | 20 |
| AVENIDA JUAREZ | 18 |
| PALM DR | 18 |
| AVENIDA ALVERA | 16 |
2004 - 2018 National Fire Incident Reporting System (NFIRS) incidents
- Incident types reported to NFIRS in Cathedral City, CA
- 13,63471.8%Rescue & EMS
- 1,7579.2%Service Call
- 1,3907.3%Fire
- 1,0975.8%Good Intent Call
- 7423.9%False Alarm
- 3601.9%Hazardous Condition
- Fire incident types reported to NFIRS in Cathedral City, CA
- 74453.5%Outside Fires
- 28920.8%Mobile Property/Vehicle Fires
- 26519.1%Structure Fires
- 926.6%Other
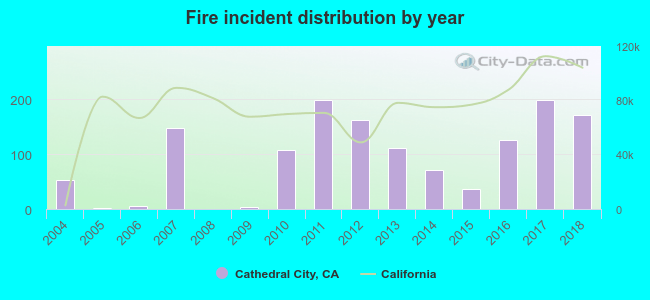 According to the data from the years 2004 - 2018 the average number of fire incidents per year is 93. The highest number of fire incidents - 198 took place in 2011, and the least - 0 in 2008. The data has a growing trend.
The average number of yearly fire incidents per 10k residents in Cathedral City, CA compared to nearest cities:
(Note: Based on data for the last 3 years, including only cities with population 5,000 and above)
| Cathedral City: | 30.9 |
| Rancho Mirage: | 1.1 |
| Palm Springs: | 39.0 |
| Palm Desert: | 0.6 |
| Indian Wells: | 1.9 |
| Desert Hot Springs: | 1.2 |
| Bermuda Dunes: | 1.4 |
| La Quinta: | 0.8 |
| Indio: | 1.2 |
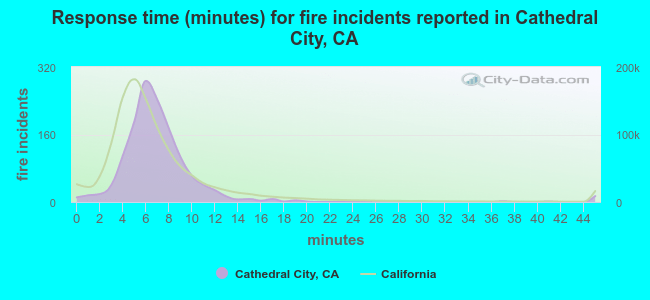 The median response time based on all reported fire incidents is 7 minutes. This is comparable to the California median value.
The median response time in Cathedral City, CA compared to nearest cities:
(Note: Based on data for all years, including only cities with at least 500 fire incidents)
| Cathedral City: | 7 minutes |
| Palm Springs: | 6 minutes |
| Hemet: | 6 minutes |
| Redlands: | 6 minutes |
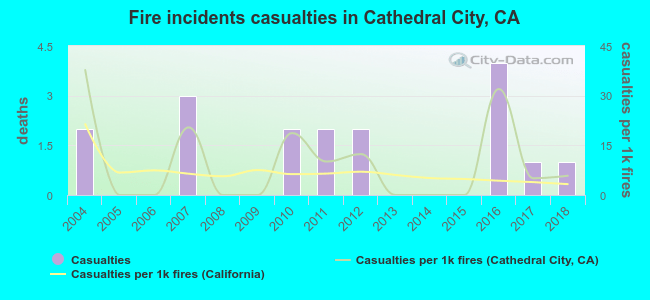 According to the reports from the years 2004 - 2018 the average number of fire-related yearly casualties is 1. The highest number of reported casualties - 4 took place in 2016, and the lowest - 0 in 2005. The data has a dropping trend.
The average number of casualties per 1,000 fires is 9. This indicator was the highest - 38 in 2004, and the lowest 0 in 2005. The trend for casualties per 1,000 incidents is dropping. Compared to the state value the number of casualties per 1,000 incidents is much higher.
According to the reports from the years 2004 - 2018 the average number of fire-related yearly casualties is 1. The highest number of reported casualties - 4 took place in 2016, and the lowest - 0 in 2005. The data has a dropping trend.
The average number of casualties per 1,000 fires is 9. This indicator was the highest - 38 in 2004, and the lowest 0 in 2005. The trend for casualties per 1,000 incidents is dropping. Compared to the state value the number of casualties per 1,000 incidents is much higher.Casualties per 1,000 incidents in Cathedral City, CA compared to nearest cities:
(Note: Based on data for all years, including only cities with at least 500 fire incidents)
| Cathedral City: | 12.2 |
| Palm Springs: | 8.7 |
| Hemet: | 11.0 |
| Redlands: | 5.5 |
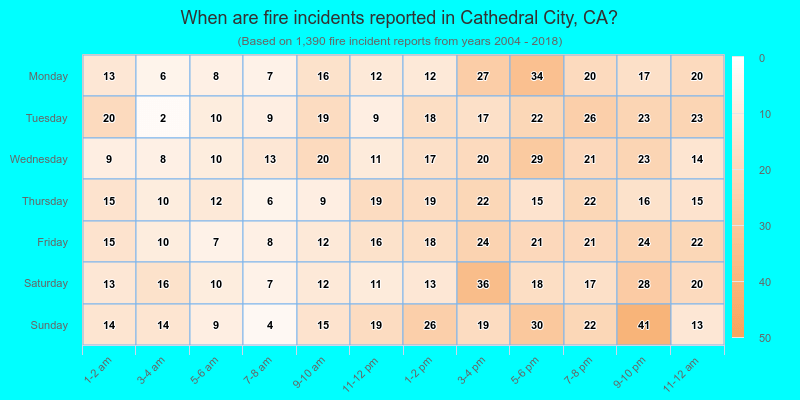
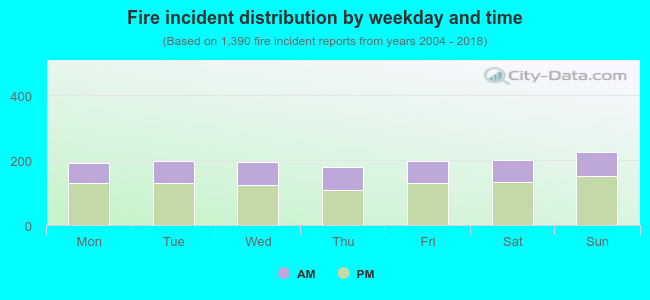 34.9% incidents where reported in the morning and 65.1% in the evening. The most fires (16.3%) took place on Sunday, and the least (12.9%) on Thursday.
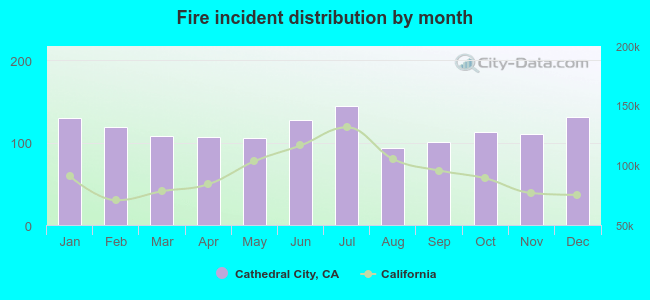 According to the 1,390 fires from years 2004 - 2018 most fires (10.4%) took place during July, and the least (6.7%) in August.
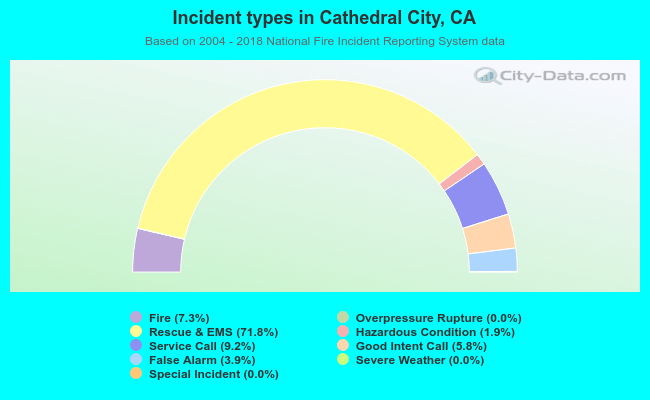 Out of all 18,998 cases reported during the years 2004 - 2018, the most belonged to the categories: Rescue & EMS (71.8%), Service Call (9.2%), and Fire (7.3%).
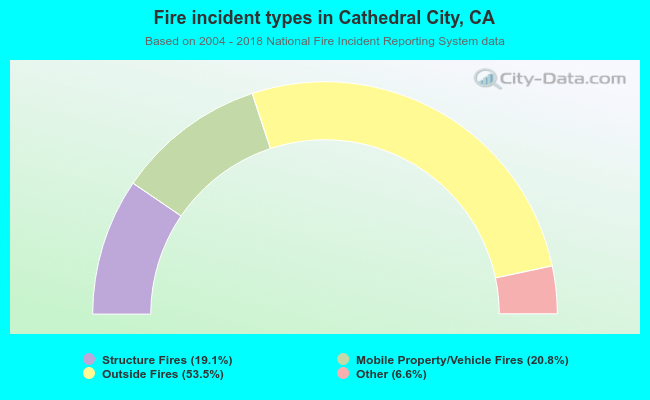 When looking into fire subcategories, the most reports belonged to: Outside Fires (53.5%), and Mobile Property/Vehicle Fires (20.8%).