Chadron: Fire Incidents, Nebraska (NE)
Where are fire incidents reported in Chadron, NE
Something went wrong! Please refresh the page.
|
| |||||||||||||||||||||||||||||||||||||||||||||||||||||||||||||||||||||||||||||||||||||||||||||||||||||||||||||
| Other | 26 | |||||||||||||||||||||||||||||||||||||||||||||||||||||||||||||||||||||||||||||||||||||||||||||||||||||||||||||
2002 - 2018 National Fire Incident Reporting System (NFIRS) incidents
- Incident types reported to NFIRS in Chadron, NE
- 15078.9%Fire
- 2312.1%False Alarm
- 84.2%Hazardous Condition
- 42.1%Rescue & EMS
- 42.1%Good Intent Call
- 10.5%Service Call
- Fire incident types reported to NFIRS in Chadron, NE
- 10872.0%Outside Fires
- 2013.3%Structure Fires
- 1812.0%Mobile Property/Vehicle Fires
- 42.7%Other
 Based on the data from the years 2002 - 2018 the average number of fire incidents per year is 9. The highest number of fire incidents - 32 took place in 2003, and the least - 0 in 2007. The data has a decreasing trend.
The average number of yearly fire incidents per 10k residents in Chadron, NE compared to nearest cities:
(Note: Based on data for the last 3 years, including only cities with population 5,000 and above)
| Chadron: | 15.6 |
| Alliance: | 5.9 |
| Scottsbluff: | 59.8 |
| Gering: | 61.3 |

 28.0% incidents where reported in the morning and 72.0% in the evening. The most fires (18.7%) took place on Thursday, and the least (10.7%) on Wednesday.
 According to the 150 incident reports from years 2002 - 2018 most fires (27.3%) took place during July, and the least (2.0%) in November.
 Out of all 190 cases reported during the years 2002 - 2018, the most belonged to the categories: Fire (78.9%), Good Intent Call (12.1%), and Rescue & EMS (4.2%).
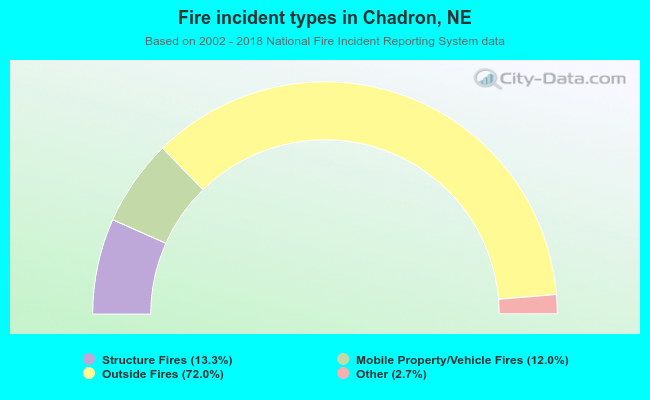 When looking into fire subcategories, the most reports belonged to: Outside Fires (72.0%), and Structure Fires (13.3%).