| Fire incidents reported |
|---|
| Sreet name | Count |
|---|
| COUNTY HIGHWAY 2 | 6 | | MAIN | 6 | | 230 SOUTH MAIN STREET | 4 | | 26711 COUNTY HIGHWAY 2 | 4 | | CHANDLERVILLE ROAD | 4 | | COTTAGE AVE | 4 | | EAST COUNTY ROAD 300 NORTH | 4 | | MAIN ST | 4 | | 10 WEST RIVER STREET | 2 | | 100 ENGLISH AVENUE | 2 | | 10255 E CR 200 N | 2 | | 11668 CR320N | 2 | | 12311 IL ROUTE 78 | 2 | | 12390 IL ROUTE 78 | 2 | | 12466 RT78 HWY | 2 | | 125 W. DOUGLAS | 2 | | 126 EAST DOUGLAS STREET | 2 | | 12726 CR300N | 2 | | 13356 IL ROUTE 78 | 2 | | 13356 IL RTE 78 | 2 | | 13477 COUNTY RD 500N | 2 | | 151 WEST LAKE STREET | 2 | | 161 CHURCH STREET | 2 | | 16238 CHANDLERVILLE RD. | 2 | | 16238.0 CHANDLERVILLE ROAD | 2 |
| | | Fire incidents reported |
|---|
| Sreet name | Count |
|---|
| 17432 CHANDLERVILLE ROAD | 2 | | 181 COTTAGE AVENUE | 2 | | 18117 GUMTOWN ROAD | 2 | | 186 CHURCH STREET | 2 | | 190 WEST LAKE STREET | 2 | | 19335 CHANDLERVILLE ROAD | 2 | | 19466 CHANDLERVILLE ROAD | 2 | | 200 N LGTS | 2 | | 201 SOUTH MAIN | 2 | | 20280 C/VILLE RD. | 2 | | 20280 CHANDLERVILLE ROAD | 2 | | 205 WEST LAKE STREET | 2 | | 206 LAKE STREET ALY | 2 | | 21090 CHANDLERVILLE ROAD | 2 | | 22229 FINN LANE | 2 | | 23165 CREEK ROAD | 2 | | 25782 OAKFORD ROAD | 2 | | 26467 OAKFORD ROAD | 2 | | 2664 N ADKINS BEACH RD | 2 | | 2664 NORTH ADKINS BEACH ROAD | 2 | | 26742 OAKFORD ROAD | 2 | | 270 4TH STREET | 2 | | 274900 N ADKINS BEACH ROAD | 2 | | 28334 OAKFORD ROAD | 2 | | |
|
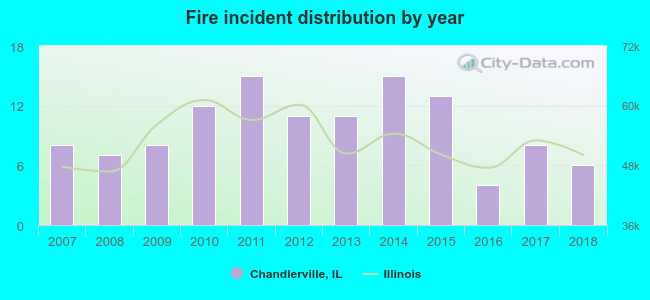 According to the data from the years 2007 - 2018 the average number of fire incidents per year is 10. The highest number of fire incidents - 15 took place in 2011, and the least - 4 in 2016. The data has a dropping trend.
 36.4% incidents where reported in the morning and 63.6% in the evening. The most fires (18.6%) took place on Sunday, and the least (11.9%) on Wednesday.
 Based on the 118 incident reports from years 2007 - 2018 most fires (16.9%) took place during October, and the least (3.4%) in December.
 Out of all 192 cases reported during the years 2007 - 2018, the most belonged to the categories: Fire (61.5%), Rescue & EMS (16.1%), and Hazardous Condition (10.4%).
 When looking into fire subcategories, the most incidents belonged to: Outside Fires (42.4%), and Structure Fires (39.8%).