Chester: Fire Incidents, California (CA)
Where are fire incidents reported in Chester, CA
Something went wrong! Please refresh the page.
|
| |||||||||||||||||||||||||||||||||||||||||||||||||||||||||||||||||||||||||||||||||||||||||||||||||||||||||||||
2005 - 2018 National Fire Incident Reporting System (NFIRS) incidents
- Incident types reported to NFIRS in Chester, CA
- 1,09758.6%Rescue & EMS
- 23112.3%Fire
- 19210.3%Service Call
- 1095.8%Good Intent Call
- 975.2%Special Incident
- 884.7%Hazardous Condition
- 552.9%False Alarm
- Fire incident types reported to NFIRS in Chester, CA
- 11348.9%Structure Fires
- 9641.6%Outside Fires
- 114.8%Mobile Property/Vehicle Fires
- 114.8%Other
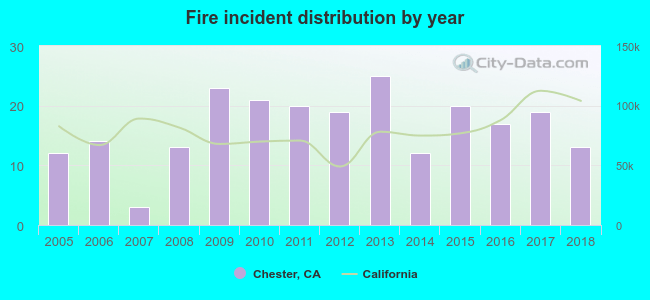 According to the data from the years 2005 - 2018 the average number of fire incidents per year is 17. The highest number of reported fires - 25 took place in 2013, and the least - 3 in 2007. The data has a growing trend.
 35.9% incidents where reported in the morning and 64.1% in the evening. The most fires (21.6%) took place on Saturday, and the least (11.3%) on Thursday.
 Based on the 231 fire incident reports from years 2005 - 2018 most fires (15.6%) took place during July, and the least (3.9%) in April.
 Out of all 1,871 cases reported during the years 2005 - 2018, the most belonged to the categories: Rescue & EMS (58.6%), Fire (12.3%), and Service Call (10.3%).
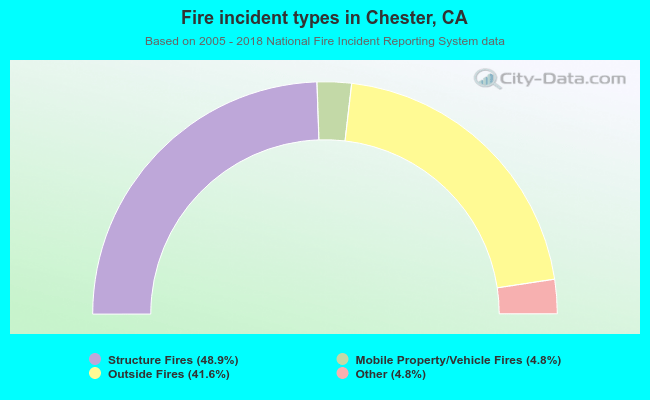 When looking into fire subcategories, the most reports belonged to: Structure Fires (48.9%), and Outside Fires (41.6%).