Chico: Fire Incidents, California (CA)
Where are fire incidents reported in Chico, CA
Something went wrong! Please refresh the page.
| Fire incidents reported | |
|---|---|
| Sreet name | Count |
| ESPLANADE | 368 |
| 6TH ST | 270 |
| NORD AVE | 258 |
| 4TH ST | 218 |
| 5TH ST | 210 |
| HWY 99 | 208 |
| 3RD ST | 200 |
| EAST AVE | 188 |
| 7TH ST | 174 |
| SACRAMENTO AVE | 142 |
| 8TH ST | 138 |
| 20TH ST | 136 |
| COHASSET RD | 126 |
| 9TH ST | 122 |
| HAZEL ST | 120 |
| HIGHWAY 32 | 114 |
| IVY ST | 104 |
| LASSEN AVE | 104 |
| MANGROVE AVE | 104 |
| SKYWAY | 100 |
| 1ST AVE | 96 |
| 2ND AVE | 96 |
| MAIN ST | 96 |
| CHESTNUT ST | 94 |
| CEDAR ST | 88 |
| FAIR ST | 88 |
| 1ST ST | 86 |
| PARK AVE | 86 |
| POMONA AVE | 86 |
| FOREST AVE | 84 |
| Other | 1,265 |
2003 - 2018 National Fire Incident Reporting System (NFIRS) incidents
- Incident types reported to NFIRS in Chico, CA
- 37,21063.7%Rescue & EMS
- 5,5699.5%Fire
- 4,9458.5%Hazardous Condition
- 4,4997.7%Service Call
- 2,9835.1%False Alarm
- 2,9405.0%Good Intent Call
- 1250.2%Special Incident
- 1140.2%Overpressure Rupture
- Fire incident types reported to NFIRS in Chico, CA
- 3,07355.2%Outside Fires
- 1,39025.0%Structure Fires
- 65311.7%Mobile Property/Vehicle Fires
- 4538.1%Other
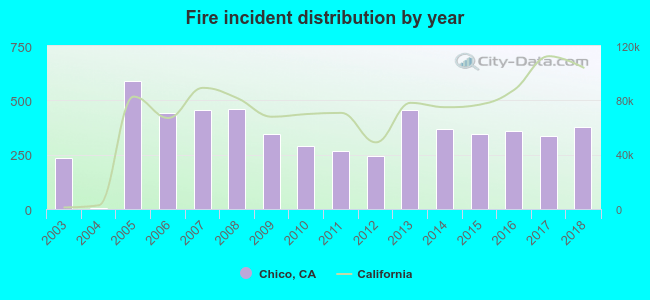 According to the data from the years 2003 - 2018 the average number of fire incidents per year is 348. The highest number of reported fires - 589 took place in 2005, and the least - 6 in 2004. The data has a growing trend.
The average number of yearly fire incidents per 10k residents in Chico, CA compared to nearest cities:
(Note: Based on data for the last 3 years, including only cities with population 5,000 and above)
| Chico: | 40.1 |
| Durham: | 19.9 |
| Paradise: | 4.4 |
| Magalia: | 0.9 |
| Orland: | 1.8 |
| Thermalito: | 30.6 |
| Oroville: | 7.8 |
| Corning: | 53.4 |
| Willows: | 77.2 |
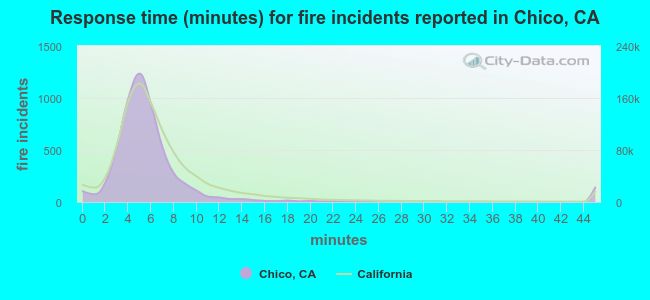 The median response time based on all reported fire incidents is 5 minutes. This is lower compared to the state median value.
The median response time in Chico, CA compared to nearest cities:
(Note: Based on data for all years, including only cities with at least 500 fire incidents)
| Chico: | 5 minutes |
| Paradise: | 4 minutes |
| Oroville: | 4 minutes |
| Corning: | 10 minutes |
| Willows: | 5 minutes |
| Palermo: | 7 minutes |
| Red Bluff: | 4 minutes |
| Colusa: | 5 minutes |
| Marysville: | 6 minutes |
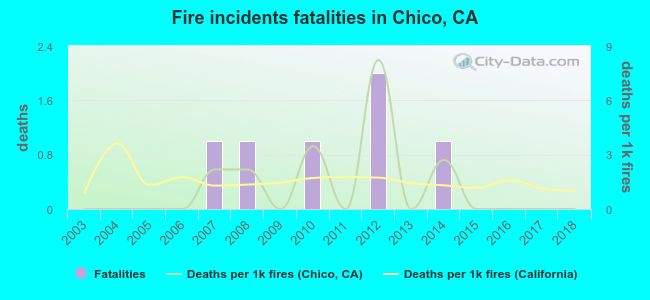 According to the data from the years 2003 - 2018 the average number of fire-related fatalities per year is 0. The highest number of deaths - 2 took place in 2012, and the lowest - 0 in 2003. The data has a constant trend.
The average number of deaths per 1,000 fire incidents is 1. This indicator was the highest - 8 in 2012, and the lowest 0 in 2003. The trend for deaths per 1,000 incidents is constant. Compared to the California value the number of fatalities per 1,000 incidents is lower.
According to the data from the years 2003 - 2018 the average number of fire-related fatalities per year is 0. The highest number of deaths - 2 took place in 2012, and the lowest - 0 in 2003. The data has a constant trend.
The average number of deaths per 1,000 fire incidents is 1. This indicator was the highest - 8 in 2012, and the lowest 0 in 2003. The trend for deaths per 1,000 incidents is constant. Compared to the California value the number of fatalities per 1,000 incidents is lower.Deaths per 1,000 incidents in Chico, CA compared to nearest cities:
(Note: Based on data for all years, including only cities with at least 2,500 fire incidents)
| Chico: | 1.1 |
| Marysville: | 2.2 |
| Yuba City: | 0.5 |
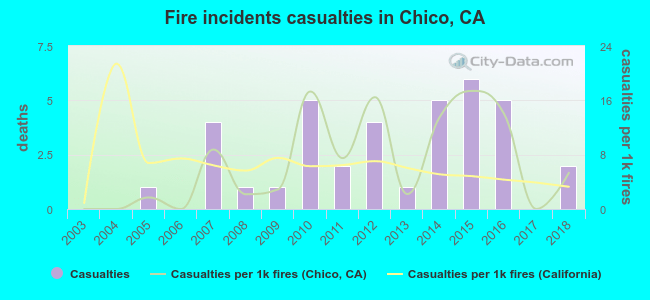 Based on the reports from the years 2003 - 2018 the average number of fire-related casualties per year is 2. The highest number of reported casualties - 6 took place in 2015, and the lowest - 0 in 2003. The data has an increasing trend.
The average number of casualties per 1,000 fire incidents is 7. This indicator was the highest - 17 in 2015, and the lowest 0 in 2003. The trend for casualties per 1,000 fire incidents is growing. Compared to the state value the number of casualties per 1,000 incidents is similar.
Based on the reports from the years 2003 - 2018 the average number of fire-related casualties per year is 2. The highest number of reported casualties - 6 took place in 2015, and the lowest - 0 in 2003. The data has an increasing trend.
The average number of casualties per 1,000 fire incidents is 7. This indicator was the highest - 17 in 2015, and the lowest 0 in 2003. The trend for casualties per 1,000 fire incidents is growing. Compared to the state value the number of casualties per 1,000 incidents is similar.
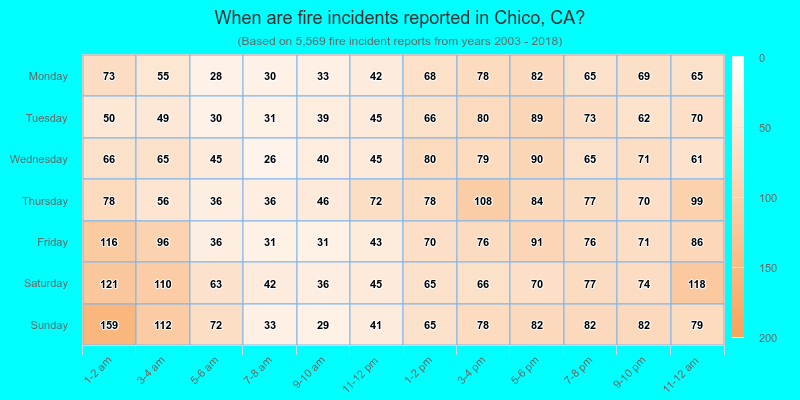
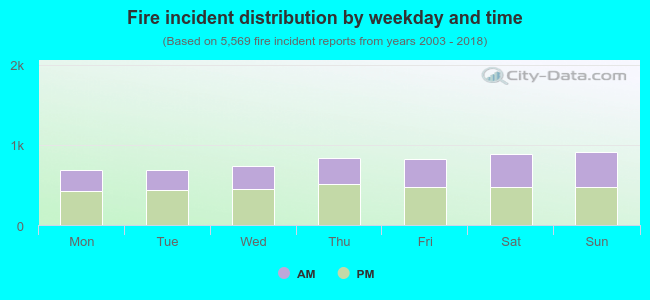 41.9% incidents where reported in the morning and 58.1% in the evening. The most fires (16.4%) took place on Sunday, and the least (12.3%) on Tuesday.
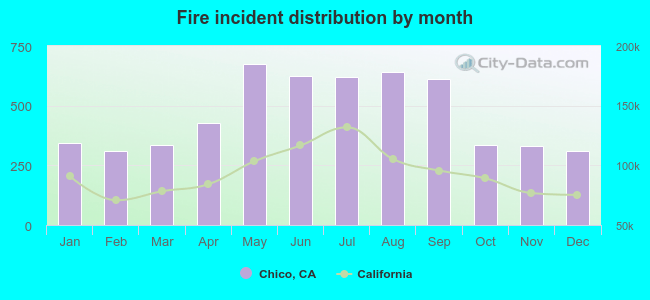 Based on the 5,569 incident reports from years 2003 - 2018 most fires (12.1%) took place during May, and the least (5.5%) in December.
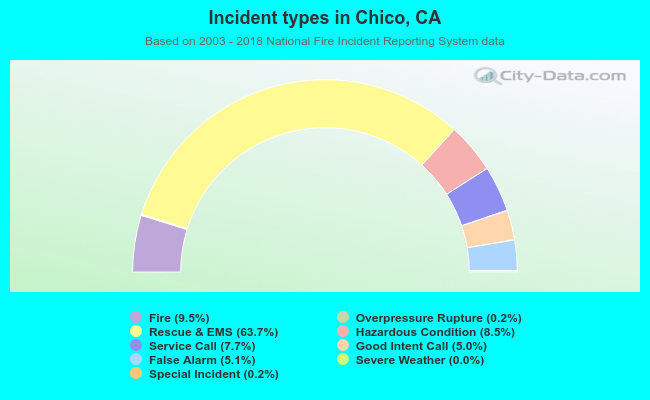 Out of all 58,398 cases reported during the years 2003 - 2018, the most belonged to the categories: Rescue & EMS (63.7%), Fire (9.5%), and Hazardous Condition (8.5%).
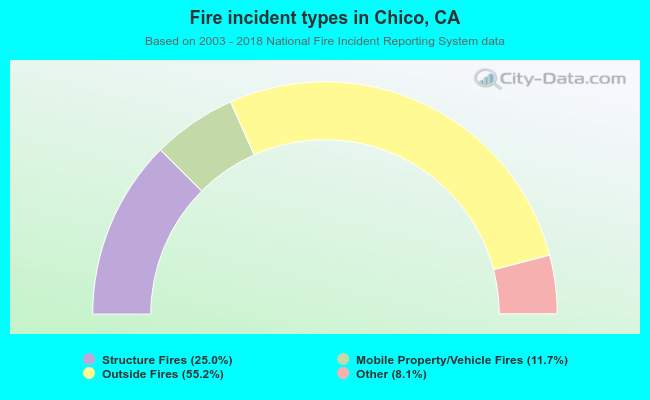 When looking into fire subcategories, the most reports belonged to: Outside Fires (55.2%), and Structure Fires (25.0%).