| Fire incidents reported |
|---|
| Sreet name | Count |
|---|
| MAIN ST | 34 | | DOWNS CHAPEL RD | 24 | | LONGRIDGE RD | 24 | | CHANCE RD | 22 | | MILLINGTON RD | 20 | | ELAINE DR | 16 | | SUDLERSVILLE RD | 16 | | DUCK CREEK RD | 14 | | HOPEWELL DR | 12 | | SMYRNA AVE | 12 | | UNDERWOODS CORNER RD | 12 | | WHEATLEYS POND RD | 12 | | BLACKISTON RD | 10 | | LION HOPE RD | 10 | | OAK HILL SCHOOL ROAD | 10 | | SEWELL BRANCH RD | 10 | | WEST DUCK CREEK RD | 10 | | CLAYTON DELANEY RD | 8 | | CLAYTON DELANEY ROAD | 8 | | HOLLETTS CORNER RD | 8 | | HOLLETTS CORNER RD | 8 | | MAIN STREET | 8 | | MOUNT FRIENDSHIP RD | 8 | | OAK HILL SCHOOL RD | 8 | | SEWELL BRANCH RD | 8 |
| | | Fire incidents reported |
|---|
| Sreet name | Count |
|---|
| BASSETT ST | 6 | | BLACKBIRD FOREST RD | 6 | | CLAYTON DELAYNEY ROAD | 6 | | RADISON RUN | 6 | | SEENEYTOWN RD | 6 | | W DUCK CREEK RD | 6 | | 150 SUNNYSIDE ROAD | 4 | | ALLEY MILL RD | 4 | | ARTHURSVILLE RD | 4 | | BLACK STALLION RD | 4 | | BLACKISTON CHURCH RD | 4 | | BLACKISTON ROAD | 4 | | BLACKSTONS RD | 4 | | BRYAN ZION RD | 4 | | BRYN ZION RD | 4 | | CHANCE RD | 4 | | CHICKEN HOUSE LN | 4 | | CLAYTON DELAYNEY RD | 4 | | CLAYTON GREENSPRING RD | 4 | | COMMERCE ST | 4 | | COOL BREEZE DR | 4 | | DOWNES CHAPEL RD | 4 | | DOWNS CHAPEL RD | 4 | | DOWNS CHAPEL ROAD | 4 | | DUCK CREEK ROAD | 4 |
|
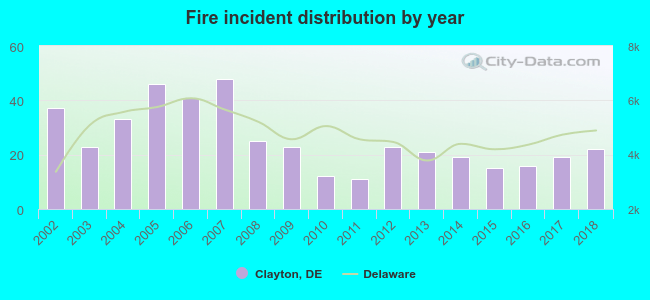 According to the data from the years 2002 - 2018 the average number of fires per year is 26. The highest number of reported fire incidents - 48 took place in 2007, and the least - 11 in 2011. The data has a decreasing trend.
 28.3% incidents where reported in the morning and 71.7% in the evening. The most fires (17.3%) took place on Saturday, and the least (12.4%) on Sunday.
 Based on the 434 fire incidents from years 2002 - 2018 most fires (16.1%) took place during March, and the least (3.2%) in October.
 Out of all 1,740 cases reported during the years 2002 - 2018, the most belonged to the categories: Fire (24.9%), Overpressure Rupture (23.4%), and Rescue & EMS (21.9%).
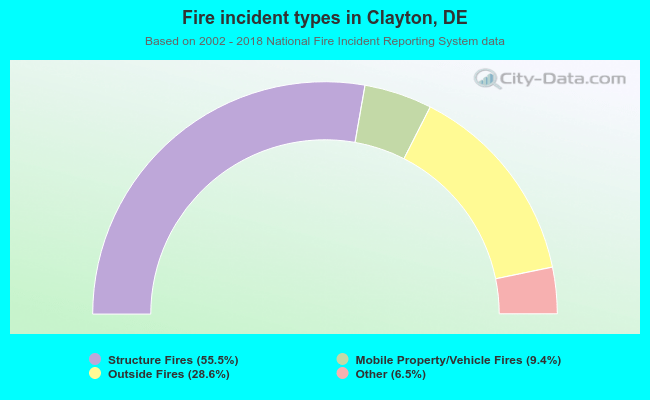 When looking into fire subcategories, the most incidents belonged to: Structure Fires (55.5%), and Outside Fires (28.6%).