Clayton: Fire Incidents, Michigan (MI)
Where are fire incidents reported in Clayton, MI
Something went wrong! Please refresh the page.
|
| |||||||||||||||||||||||||||||||||||||||||||||||||||||||||||||||||||||||||||||||||||||||||||||||||||||||||||||
2002 - 2018 National Fire Incident Reporting System (NFIRS) incidents
- Incident types reported to NFIRS in Clayton, MI
- 57847.4%Rescue & EMS
- 27922.9%Fire
- 1068.7%Special Incident
- 917.5%Service Call
- 796.5%Hazardous Condition
- 483.9%Good Intent Call
- 363.0%Severe Weather
- 20.2%False Alarm
- Fire incident types reported to NFIRS in Clayton, MI
- 15154.1%Structure Fires
- 8831.5%Outside Fires
- 279.7%Mobile Property/Vehicle Fires
- 134.7%Other
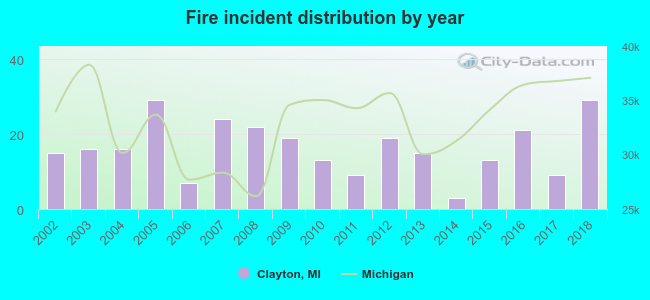 Based on the data from the years 2002 - 2018 the average number of fires per year is 16. The highest number of reported fire incidents - 29 took place in 2005, and the least - 3 in 2014. The data has a rising trend.
 32.6% incidents where reported in the morning and 67.4% in the evening. The most fires (22.6%) took place on Saturday, and the least (8.6%) on Sunday.
 Based on the 279 fire incident reports from years 2002 - 2018 most fires (15.1%) took place during April, and the least (3.9%) in October.
 Out of all 1,220 cases reported during the years 2002 - 2018, the most belonged to the categories: Rescue & EMS (47.4%), Fire (22.9%), and Special Incident (8.7%).
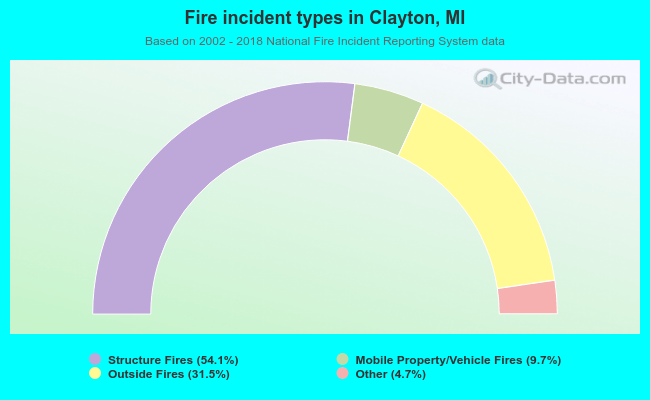 When looking into fire subcategories, the most incidents belonged to: Structure Fires (54.1%), and Outside Fires (31.5%).