| Fire incidents reported |
|---|
| Sreet name | Count |
|---|
| STATE ROUTE 12 | 60 | | COUNTY ROUTE 3 | 26 | | COUNTY ROUTE 5 | 22 | | COUNTY ROUTE 181 | 14 | | NYS 12 HWY | 12 | | STRAWBERRY LANE | 12 | | COUNTY ROAD 181 | 10 | | FRENCH CREEK ROAD | 10 | | RIVERSIDE DRIVE | 10 | | COUNTY ROUTE 4 | 8 | | HOUSE ROAD | 8 | | OLD TOWN SPRINGS RD | 8 | | STATE ROUTE 12E | 8 | | STRAWBERRY LN | 8 | | BALD ROCK RD | 6 | | GRINDSTONE | 6 | | JAMES STREET | 6 | | STATE ROUTE 180 | 6 | | STATE ST | 6 | | SYLVESTER ROAD | 6 | | VANALSTYNE ROAD | 6 | | WEBB ST | 6 | | WEBB STREET | 6 | | WOOD RD | 6 | | WOOD RD | 6 |
| | | Fire incidents reported |
|---|
| Sreet name | Count |
|---|
| BALD ROCK RD | 4 | | BARTLETT POINT ROAD | 4 | | BLANCHARD LN W | 4 | | CO RT 181 RD | 4 | | COUNTY ROAD 12 | 4 | | CROSS ISLAND RD | 4 | | DEFERNO ROAD | 4 | | FRENCH CREEK RD | 4 | | HERITAGE DR | 4 | | HUGUNIN | 4 | | JOHN STREET | 4 | | LOVERS LANE | 4 | | MACOMB SETTLEMENT RD RD | 4 | | MERRICK ST | 4 | | OLD TOWN SPRINGS RD | 4 | | RIVERWOOD ESTATES LN | 4 | | SCHNAUBER RD | 4 | | SMITHERING HEIGHTS RD | 4 | | SMITHERING HEIGHTS ROAD | 4 | | STATE ROUTE 411 | 4 | | STATE RT 12 | 4 | | STATE STREET | 4 | | THERESA ST | 4 | | UNION ST | 4 | | |
|
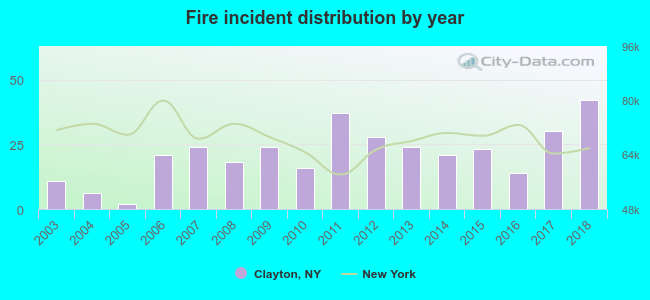 Based on the data from the years 2003 - 2018 the average number of fire incidents per year is 21. The highest number of reported fire incidents - 42 took place in 2018, and the least - 2 in 2005. The data has a growing trend.
 36.1% incidents where reported in the morning and 63.9% in the evening. The most fires (19.6%) took place on Sunday, and the least (11.1%) on Thursday.
 According to the 341 reports from years 2003 - 2018 most fires (14.1%) took place during July, and the least (4.1%) in October.
 Out of all 1,497 cases reported during the years 2003 - 2018, the most belonged to the categories: Good Intent Call (23.6%), Rescue & EMS (23.0%), and Fire (22.8%).
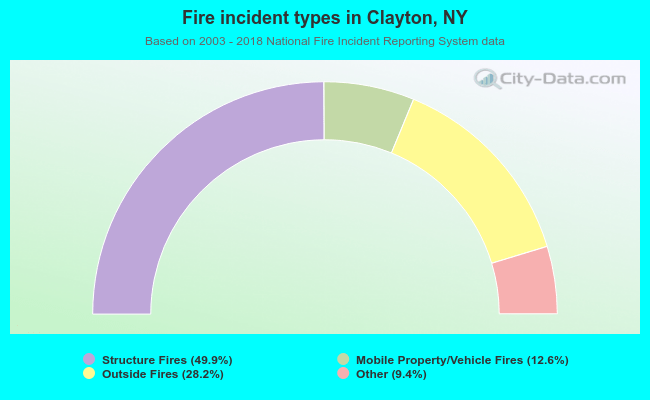 When looking into fire subcategories, the most incidents belonged to: Structure Fires (49.9%), and Outside Fires (28.2%).