Cleveland: Fire Incidents, Tennessee (TN)
Where are fire incidents reported in Cleveland, TN
Something went wrong! Please refresh the page.
| Fire incidents reported | |
|---|---|
| Sreet name | Count |
| KEITH ST | 272 |
| WATERLEVEL HWY | 242 |
| SPRING PLACE RD | 226 |
| DALTON PIKE | 198 |
| GEORGETOWN RD | 198 |
| BENTON PIKE | 180 |
| SOUTH LEE HWY | 166 |
| BLUE SPRINGS RD | 146 |
| INTERSTATE 75 | 146 |
| I75 | 144 |
| PAUL HUFF PKY | 134 |
| 20TH ST | 132 |
| INMAN ST | 132 |
| BATES PIKE | 122 |
| MAGNOLIA AVE | 122 |
| APD 40 BYP | 116 |
| MOUSE CREEK RD | 112 |
| 25TH ST | 110 |
| 8TH ST | 106 |
| OCOEE ST | 106 |
| HARRISON PIKE | 104 |
| 6TH ST | 92 |
| OLD CHATTANOOGA PIKE | 90 |
| FRONTAGE RD | 86 |
| STUART RD | 80 |
| BUCHANAN RD | 78 |
| WILDWOOD AVE | 76 |
| BLYTHE AVE | 72 |
| CHURCH ST | 72 |
| KEITH VALLEY RD | 68 |
| Other | 3,439 |
2002 - 2018 National Fire Incident Reporting System (NFIRS) incidents
- Incident types reported to NFIRS in Cleveland, TN
- 10,19136.4%Rescue & EMS
- 7,36726.3%Fire
- 3,03110.8%Good Intent Call
- 2,94310.5%False Alarm
- 2,4978.9%Hazardous Condition
- 1,2314.4%Service Call
- 6642.4%Special Incident
- 610.2%Overpressure Rupture
- 410.1%Severe Weather
- Fire incident types reported to NFIRS in Cleveland, TN
- 3,66349.7%Outside Fires
- 2,26930.8%Structure Fires
- 1,25117.0%Mobile Property/Vehicle Fires
- 1842.5%Other
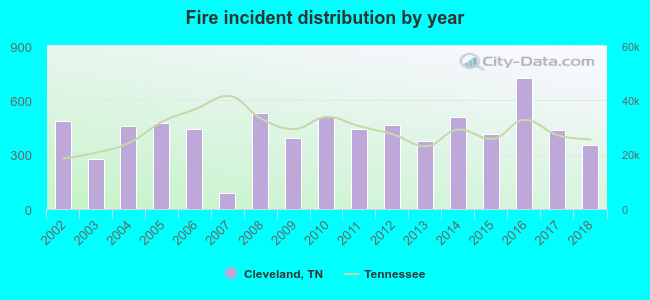 According to the data from the years 2002 - 2018 the average number of fire incidents per year is 433. The highest number of reported fire incidents - 722 took place in 2016, and the least - 88 in 2007. The data has a declining trend.
The average number of yearly fire incidents per 10k residents in Cleveland, TN compared to nearest cities:
(Note: Based on data for the last 3 years, including only cities with population 5,000 and above)
| Cleveland: | 116.6 |
| Collegedale: | 15.5 |
| Harrison: | 9.9 |
| Sale Creek: | 8.3 |
| Dayton: | 153.7 |
| East Ridge: | 50.4 |
| Chattanooga: | 46.2 |
| Athens: | 121.5 |
| Red Bank: | 2.5 |
 The median response time based on all reported fire incidents is 6 minutes. This is comparable to the Tennessee median value.
The median response time in Cleveland, TN compared to nearest cities:
(Note: Based on data for all years, including only cities with at least 500 fire incidents)
| Cleveland: | 6 minutes |
| Calhoun: | 5 minutes |
| Ooltewah: | 8 minutes |
| Riceville: | 11 minutes |
| Etowah: | 8 minutes |
| Ringgold: | 9 minutes |
| Dayton: | 4 minutes |
| East Ridge: | 4 minutes |
| Chattanooga: | 5 minutes |
 Based on the reports from the years 2002 - 2018 the average number of fire-related yearly deaths is 1. The highest number of deaths - 4 took place in 2009, and the lowest - 0 in 2002. The data has an increasing trend.
The average number of fatalities per 1,000 fire incidents is 3. This indicator was the highest - 11 in 2007, and the lowest 0 in 2002. The trend for fatalities per 1,000 fires is rising. Compared to the Tennessee value the number of deaths per 1,000 incidents is lower.
Based on the reports from the years 2002 - 2018 the average number of fire-related yearly deaths is 1. The highest number of deaths - 4 took place in 2009, and the lowest - 0 in 2002. The data has an increasing trend.
The average number of fatalities per 1,000 fire incidents is 3. This indicator was the highest - 11 in 2007, and the lowest 0 in 2002. The trend for fatalities per 1,000 fires is rising. Compared to the Tennessee value the number of deaths per 1,000 incidents is lower.Deaths per 1,000 incidents in Cleveland, TN compared to nearest cities:
(Note: Based on data for all years, including only cities with at least 2,500 fire incidents)
| Cleveland: | 2.9 |
| Ringgold: | 1.7 |
| Chattanooga: | 2.7 |
| Athens: | 4.4 |
| Rossville: | 2.8 |
| Dalton: | 3.3 |
 Based on the data from the years 2002 - 2018 the average number of fire-related casualties per year is 4. The highest number of reported injuries - 9 took place in 2008, and the lowest - 0 in 2007. The data has a declining trend.
The average number of casualties per 1,000 fire incidents is 8. This indicator was the highest - 22 in 2003, and the lowest 0 in 2007. The trend for casualties per 1,000 fire incidents is dropping. Compared to the Tennessee value the number of injuries per 1,000 incidents is about the same.
Based on the data from the years 2002 - 2018 the average number of fire-related casualties per year is 4. The highest number of reported injuries - 9 took place in 2008, and the lowest - 0 in 2007. The data has a declining trend.
The average number of casualties per 1,000 fire incidents is 8. This indicator was the highest - 22 in 2003, and the lowest 0 in 2007. The trend for casualties per 1,000 fire incidents is dropping. Compared to the Tennessee value the number of injuries per 1,000 incidents is about the same.Casualties per 1,000 incidents in Cleveland, TN compared to nearest cities:
(Note: Based on data for all years, including only cities with at least 500 fire incidents)
| Cleveland: | 8.7 |
| Calhoun: | 0.0 |
| Ooltewah: | 0.0 |
| Riceville: | 6.9 |
| Etowah: | 0.8 |
| Ringgold: | 3.5 |
| Dayton: | 39.9 |
| East Ridge: | 6.2 |
| Chattanooga: | 8.7 |
 27.1% incidents where reported in the morning and 72.9% in the evening. The most fires (15.6%) took place on Saturday, and the least (13.5%) on Wednesday.
 According to the 7,367 fire incident reports from years 2002 - 2018 most fires (11.7%) took place during March, and the least (6.6%) in December.
 Out of all 28,026 cases reported during the years 2002 - 2018, the most belonged to the categories: Rescue & EMS (36.4%), Fire (26.3%), and Good Intent Call (10.8%).
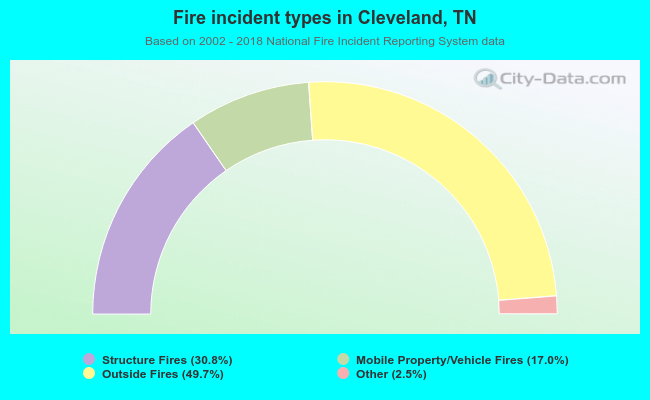 When looking into fire subcategories, the most incidents belonged to: Outside Fires (49.7%), and Structure Fires (30.8%).