Climax: Fire Incidents, Michigan (MI)
Where are fire incidents reported in Climax, MI
Something went wrong! Please refresh the page.
|
| |||||||||||||||||||||||||||||||||||||||||||||||||||||||||||||||||||||||||||||||||||||||||||||||||||||||||||||
2002 - 2018 National Fire Incident Reporting System (NFIRS) incidents
- Incident types reported to NFIRS in Climax, MI
- 39852.1%Rescue & EMS
- 22229.1%Fire
- 638.2%Hazardous Condition
- 486.3%Good Intent Call
- 152.0%Service Call
- 121.6%False Alarm
- 40.5%Special Incident
- 10.1%Overpressure Rupture
- 10.1%Severe Weather
- Fire incident types reported to NFIRS in Climax, MI
- 9542.8%Structure Fires
- 8839.6%Outside Fires
- 3515.8%Mobile Property/Vehicle Fires
- 41.8%Other
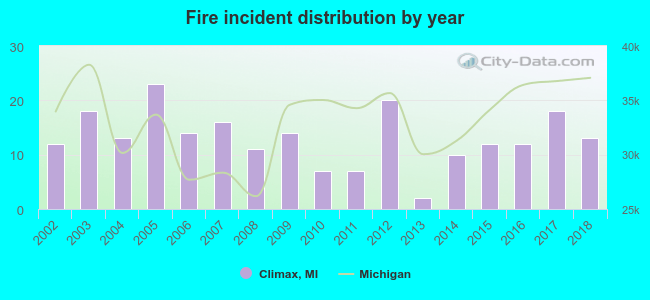 Based on the data from the years 2002 - 2018 the average number of fires per year is 13. The highest number of reported fire incidents - 23 took place in 2005, and the least - 2 in 2013. The data has a rising trend.
 32.9% incidents where reported in the morning and 67.1% in the evening. The most fires (22.1%) took place on Sunday, and the least (9.5%) on Tuesday.
 Based on the 222 fire incident reports from years 2002 - 2018 most fires (21.2%) took place during April, and the least (5.0%) in February.
 Out of all 764 cases reported during the years 2002 - 2018, the most belonged to the categories: Rescue & EMS (52.1%), Fire (29.1%), and Hazardous Condition (8.2%).
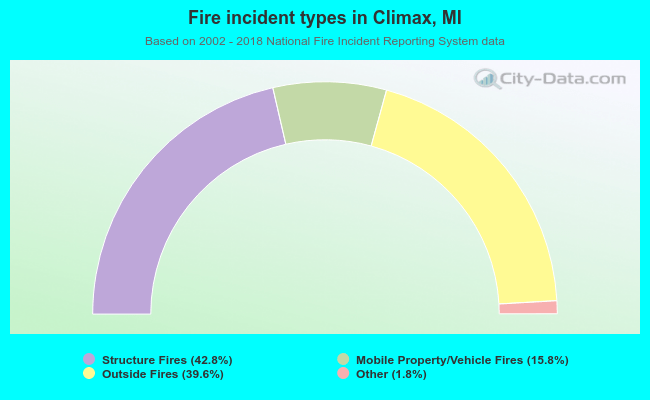 When looking into fire subcategories, the most incidents belonged to: Structure Fires (42.8%), and Outside Fires (39.6%).