Cocoa: Fire Incidents, Florida (FL)
Where are fire incidents reported in Cocoa, FL
Something went wrong! Please refresh the page.
| Fire incidents reported | |
|---|---|
| Sreet name | Count |
| CLEARLAKE RD | 122 |
| DIXON BLVD | 74 |
| COCOA BLVD | 72 |
| I 95 | 68 |
| FISKE BLVD | 64 |
| KING ST | 62 |
| LAKE DR | 46 |
| CANAVERAL GROVES BLVD | 44 |
| FRIDAY | 40 |
| FRIDAY RD | 40 |
| COX RD | 38 |
| PEACHTREE ST | 38 |
| US 1 | 38 |
| KING | 34 |
| GRISSOM PKY | 28 |
| 520 | 26 |
| ERICA | 26 |
| PALM AVE | 26 |
| SR-524 | 26 |
| 524 | 24 |
| CLEARLAKE | 24 |
| HIGHWAY 1 | 24 |
| SCHOOL ST | 24 |
| I-95 | 22 |
| SATELLITE BLVD | 22 |
| US1 | 22 |
| ADAMSON | 20 |
| ASTER DR | 20 |
| BREVARD AVE | 20 |
| COX | 20 |
| Other | 1,840 |
2003 - 2018 National Fire Incident Reporting System (NFIRS) incidents
- Incident types reported to NFIRS in Cocoa, FL
- 25,43077.1%Rescue & EMS
- 2,9949.1%Fire
- 1,5144.6%Good Intent Call
- 1,4244.3%Hazardous Condition
- 1,1383.5%Service Call
- 4301.3%False Alarm
- Fire incident types reported to NFIRS in Cocoa, FL
- 1,64554.9%Outside Fires
- 72024.0%Structure Fires
- 48716.3%Mobile Property/Vehicle Fires
- 1424.7%Other
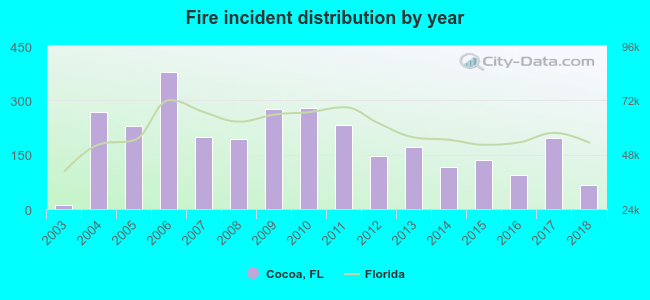 Based on the data from the years 2003 - 2018 the average number of fires per year is 187. The highest number of fire incidents - 379 took place in 2006, and the least - 12 in 2003. The data has a growing trend.
The average number of yearly fire incidents per 10k residents in Cocoa, FL compared to nearest cities:
(Note: Based on data for the last 3 years, including only cities with population 5,000 and above)
| Cocoa: | 68.3 |
| Rockledge: | 25.2 |
| Merritt Island: | 26.7 |
| Cocoa Beach: | 12.0 |
| Cape Canaveral: | 37.8 |
| South Patrick Shores: | 4.5 |
| Titusville: | 45.0 |
| Satellite Beach: | 27.5 |
| Indian Harbour Beach: | 12.8 |
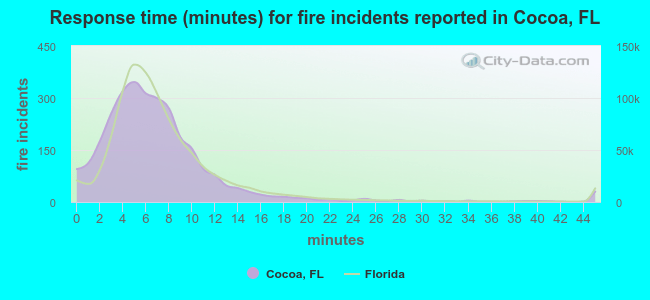 The median response time based on all reported fire incidents is 6 minutes. This is about the same as the state median value.
The median response time in Cocoa, FL compared to nearest cities:
(Note: Based on data for all years, including only cities with at least 500 fire incidents)
| Cocoa: | 6 minutes |
| Rockledge: | 5 minutes |
| Merritt Island: | 7 minutes |
| Cape Canaveral: | 4 minutes |
| Titusville: | 5 minutes |
| Satellite Beach: | 5 minutes |
| Melbourne: | 5 minutes |
| West Melbourne: | 7 minutes |
| Mims: | 8 minutes |
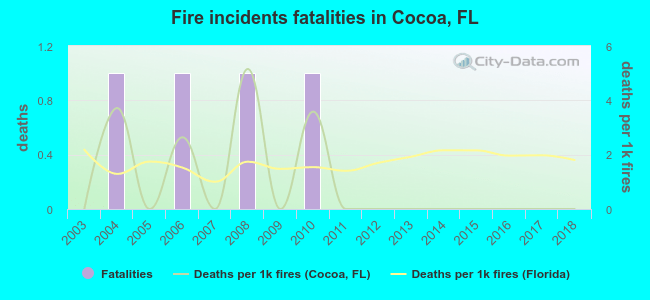 According to the reports from the years 2003 - 2018 the average number of fire-related yearly deaths is 0. The highest number of reported deaths - 1 took place in 2004, and the lowest - 0 in 2003. The data has a constant trend.
The average number of fatalities per 1,000 fires is 1. This indicator was the highest - 5 in 2008, and the lowest 0 in 2003. The trend for deaths per 1,000 fire incidents is constant. Compared to the Florida value the number of deaths per 1,000 fires is lower.
According to the reports from the years 2003 - 2018 the average number of fire-related yearly deaths is 0. The highest number of reported deaths - 1 took place in 2004, and the lowest - 0 in 2003. The data has a constant trend.
The average number of fatalities per 1,000 fires is 1. This indicator was the highest - 5 in 2008, and the lowest 0 in 2003. The trend for deaths per 1,000 fire incidents is constant. Compared to the Florida value the number of deaths per 1,000 fires is lower.
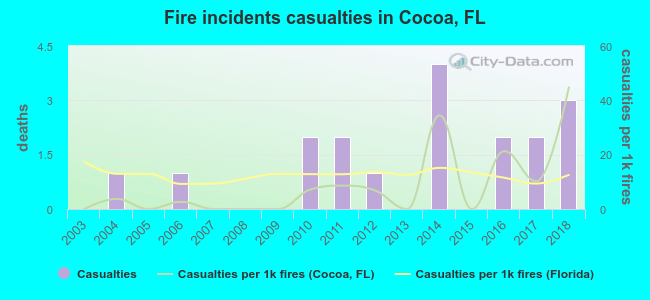 Based on the reports from the years 2003 - 2018 the average number of fire-related yearly casualties is 1. The highest number of injuries - 4 took place in 2014, and the lowest - 0 in 2003. The data has a growing trend.
The average number of casualties per 1,000 fire incidents is 9. This indicator was the highest - 45 in 2018, and the lowest 0 in 2003. The trend for casualties per 1,000 fires is rising. Compared to the Florida value the number of injuries per 1,000 incidents is much lower.
Based on the reports from the years 2003 - 2018 the average number of fire-related yearly casualties is 1. The highest number of injuries - 4 took place in 2014, and the lowest - 0 in 2003. The data has a growing trend.
The average number of casualties per 1,000 fire incidents is 9. This indicator was the highest - 45 in 2018, and the lowest 0 in 2003. The trend for casualties per 1,000 fires is rising. Compared to the Florida value the number of injuries per 1,000 incidents is much lower.Casualties per 1,000 incidents in Cocoa, FL compared to nearest cities:
(Note: Based on data for all years, including only cities with at least 500 fire incidents)
| Cocoa: | 6.0 |
| Rockledge: | 18.6 |
| Merritt Island: | 10.1 |
| Cape Canaveral: | 4.9 |
| Titusville: | 12.2 |
| Satellite Beach: | 14.8 |
| Melbourne: | 19.4 |
| West Melbourne: | 7.1 |
| Mims: | 12.4 |
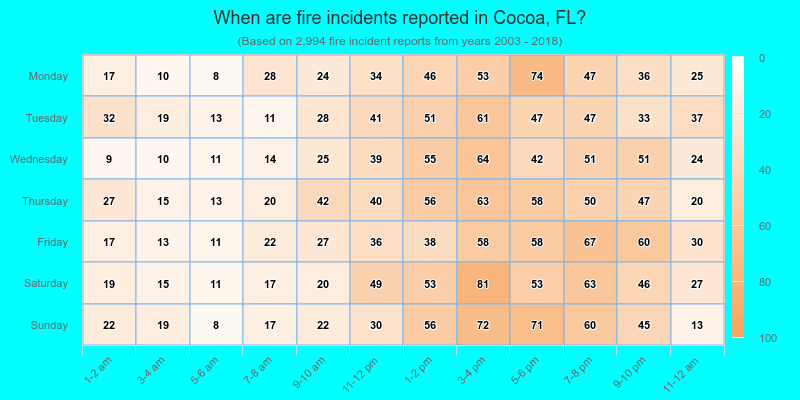
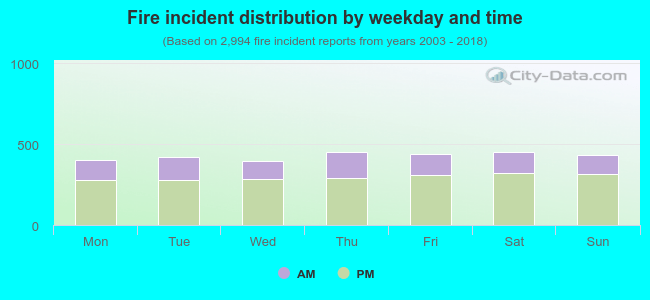 30.2% incidents where reported in the morning and 69.8% in the evening. The most fires (15.2%) took place on Saturday, and the least (13.2%) on Wednesday.
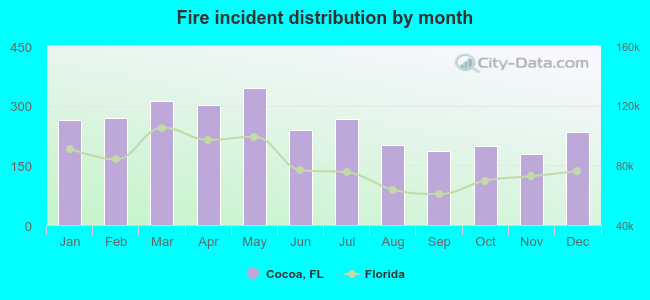 Based on the 2,994 fire incidents from years 2003 - 2018 most fires (11.5%) took place during May, and the least (6.0%) in November.
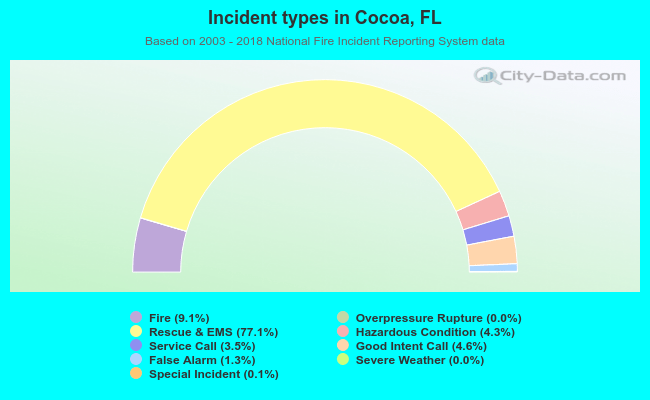 Out of all 32,965 cases reported during the years 2003 - 2018, the most belonged to the categories: Rescue & EMS (77.1%), Fire (9.1%), and Good Intent Call (4.6%).
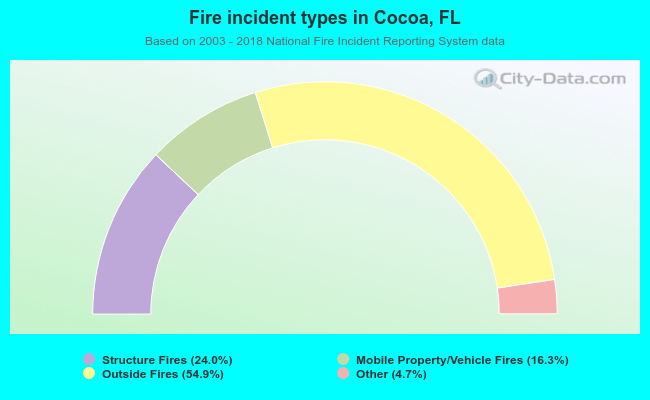 When looking into fire subcategories, the most incidents belonged to: Outside Fires (54.9%), and Structure Fires (24.0%).