Cohutta: Fire Incidents, Georgia (GA)
Where are fire incidents reported in Cohutta, GA
Something went wrong! Please refresh the page.
|
| |||||||||||||||||||||||||||||||||||||||||||||||||||||||||||||||||||||||||||||||||||||||||||||||||||||||||||||
2004 - 2018 National Fire Incident Reporting System (NFIRS) incidents
- Incident types reported to NFIRS in Cohutta, GA
- 1,36661.8%Rescue & EMS
- 29713.4%Fire
- 1868.4%Good Intent Call
- 1466.6%Hazardous Condition
- 1416.4%Service Call
- 723.3%False Alarm
- Fire incident types reported to NFIRS in Cohutta, GA
- 14247.8%Outside Fires
- 11639.1%Structure Fires
- 3612.1%Mobile Property/Vehicle Fires
- 31.0%Other
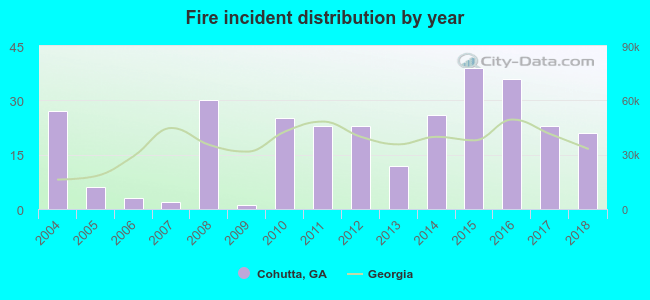 Based on the data from the years 2004 - 2018 the average number of fire incidents per year is 20. The highest number of reported fire incidents - 39 took place in 2015, and the least - 1 in 2009. The data has a declining trend.
 According to the reports from the years 2004 - 2018 the average number of fire-related yearly casualties is 0. The highest number of casualties - 1 took place in 2011, and the lowest - 0 in 2004. The data has a constant trend.
 26.6% incidents where reported in the morning and 73.4% in the evening. The most fires (19.9%) took place on Sunday, and the least (9.4%) on Wednesday.
 Based on the 297 fires from years 2004 - 2018 most fires (11.8%) took place during April, and the least (4.7%) in December.
 Out of all 2,211 cases reported during the years 2004 - 2018, the most belonged to the categories: Rescue & EMS (61.8%), Fire (13.4%), and Good Intent Call (8.4%).
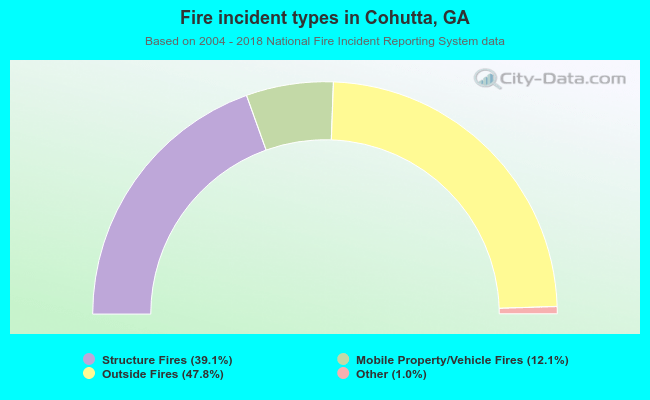 When looking into fire subcategories, the most reports belonged to: Outside Fires (47.8%), and Structure Fires (39.1%).