| Fire incidents reported |
|---|
| Sreet name | Count |
|---|
| ROUTE 9 | 60 | | ROUTE 301 | 34 | | MAIN ST | 26 | | MAIN ST | 16 | | EAST MOUNTAIN ROAD SOUTH | 14 | | MAIN STREET | 14 | | RT 9D | 14 | | WINDY RIDGE | 12 | | CHESTNUT ST | 10 | | ROUTE 9D | 10 | | CHESTNUT ST | 8 | | DEPOT SQUARE | 8 | | EAST MOUNTAIN ROAD NORTH | 8 | | FISHKILL ROAD | 8 | | CHESTNUT STREET | 6 | | HIGH ST | 6 | | MAIN ST. | 6 | | MARKET ST | 6 | | MARKET ST | 6 | | PERKS BLVD | 6 | | ALLEN LANE | 4 | | ESSELBORNE RD | 4 | | FISHKILL ROAD RD | 4 | | FOUNDRY POND ROAD | 4 | | HUSTIS ROAD | 4 |
| | | Fire incidents reported |
|---|
| Sreet name | Count |
|---|
| HUSTIS ROAD RD | 4 | | INDIAN BROOK | 4 | | JOANN PLACE | 4 | | KNOLLWOOD LN | 4 | | LANE GATE ROAD | 4 | | LOWER STATION ROAD | 4 | | MORRIS AVE | 4 | | MOUNTAIN ROAD SOUTH RD | 4 | | OLD ALBANY POST ROAD | 4 | | OLD POSTAL RD | 4 | | ORCHARD STREET | 4 | | PARROTT ST | 4 | | PARSONAGE ST | 4 | | PARSONAGE STREET | 4 | | PEARL ST | 4 | | PEARL STREET | 4 | | ROUTE 301 RT | 4 | | ROUTE 9 D | 4 | | ROUTE 9 RT | 4 | | RT 9 | 4 | | RT. 9D | 4 | | RTE 9D | 4 | | RTE. 9D | 4 | | STONECROP LN | 4 | | SUNKIN MIND RD | 4 |
|
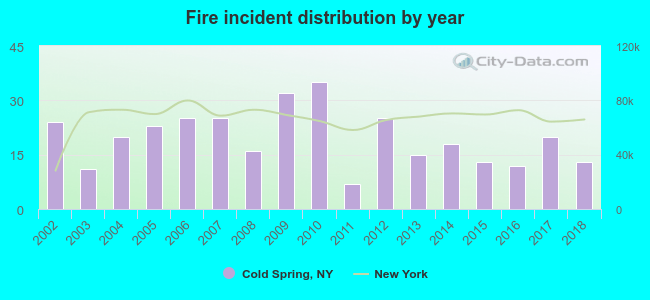 According to the data from the years 2002 - 2018 the average number of fires per year is 20. The highest number of fire incidents - 35 took place in 2010, and the least - 7 in 2011. The data has a declining trend.
 29.6% incidents where reported in the morning and 70.4% in the evening. The most fires (16.8%) took place on Friday, and the least (11.7%) on Tuesday.
 According to the 334 reports from years 2002 - 2018 most fires (13.2%) took place during April, and the least (4.2%) in July.
 Out of all 2,057 cases reported during the years 2002 - 2018, the most belonged to the categories: Good Intent Call (23.3%), Rescue & EMS (21.0%), and Overpressure Rupture (18.3%).
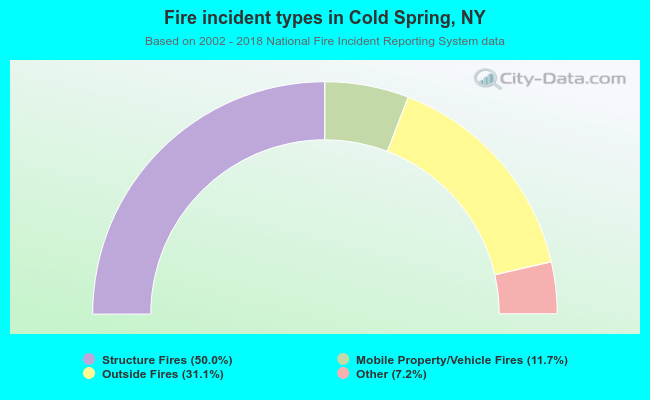 When looking into fire subcategories, the most incidents belonged to: Structure Fires (50.0%), and Outside Fires (31.1%).