Columbus: Fire Incidents, Ohio (OH)
Where are fire incidents reported in Columbus, OH
Something went wrong! Please refresh the page.
| Fire incidents reported | |
|---|---|
| Sreet name | Count |
| HIGH ST | 830 |
| BROAD ST | 676 |
| CLEVELAND | 570 |
| SULLIVANT AVE | 462 |
| CLEVELAND AVE | 362 |
| WEDGEWOOD DR | 322 |
| LIVINGSTON AVE | 290 |
| PARSONS AVE | 260 |
| HIGH ST | 252 |
| WARREN AVE | 232 |
| 5TH AVE | 214 |
| HARRIS AVE | 214 |
| MAIN ST | 198 |
| REFUGEE RD | 198 |
| MOUND ST | 196 |
| ALUM CREEK DR | 194 |
| EUREKA AVE | 194 |
| MORSE RD | 192 |
| HAMILTON RD | 188 |
| OLENTANGY RIVER RD | 180 |
| SUMMIT ST | 180 |
| CHAMPION AVE | 178 |
| DUBLIN GRANVILLE RD | 178 |
| EAKIN RD | 178 |
| WAYNE AVE | 178 |
| HAGUE AVE | 172 |
| CENTRAL AVE | 170 |
| GEORGESVILLE RD | 170 |
| RICHARDSON AVE | 170 |
| 4TH ST | 168 |
| Other | 28,183 |
2003 - 2018 National Fire Incident Reporting System (NFIRS) incidents
- Incident types reported to NFIRS in Columbus, OH
- 492,84670.4%Rescue & EMS
- 82,16611.7%Good Intent Call
- 36,1495.2%Fire
- 33,5184.8%False Alarm
- 27,5143.9%Hazardous Condition
- 25,3823.6%Service Call
- 1,5400.2%Special Incident
- 7280.1%Overpressure Rupture
- Fire incident types reported to NFIRS in Columbus, OH
- 17,43148.2%Structure Fires
- 12,55834.7%Outside Fires
- 6,06716.8%Mobile Property/Vehicle Fires
- 930.3%Other
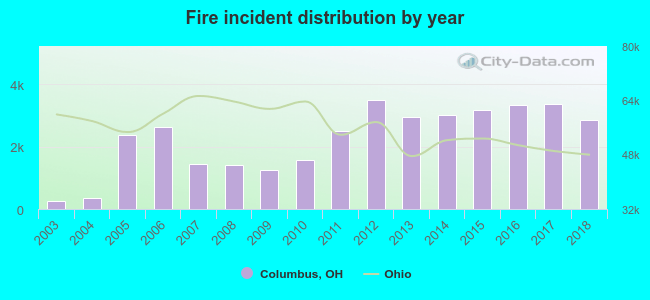 According to the data from the years 2003 - 2018 the average number of fire incidents per year is 2,254. The highest number of fires - 3,488 took place in 2012, and the least - 257 in 2003. The data has an increasing trend.
The average number of yearly fire incidents per 10k residents in Columbus, OH compared to nearest cities:
(Note: Based on data for the last 3 years, including only cities with population 5,000 and above)
| Columbus: | 38.2 |
| Grandview Heights: | 16.1 |
| Bexley: | 9.6 |
| Upper Arlington: | 17.7 |
| Whitehall: | 50.3 |
| Gahanna: | 20.2 |
| Worthington: | 24.6 |
| Hilliard: | 26.7 |
| Grove City: | 17.6 |
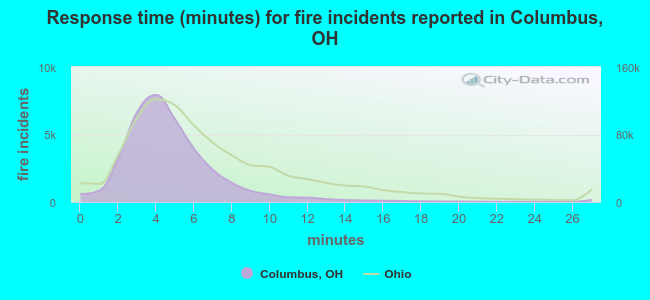 The median response time based on all reported fire incidents is 4 minutes. This is lower compared to the state median value.
The median response time in Columbus, OH compared to nearest cities:
(Note: Based on data for all years, including only cities with at least 500 fire incidents)
| Columbus: | 4 minutes |
| Upper Arlington: | 5 minutes |
| Whitehall: | 4 minutes |
| Gahanna: | 5 minutes |
| Worthington: | 4 minutes |
| Hilliard: | 6 minutes |
| Grove City: | 5 minutes |
| Westerville: | 6 minutes |
| Reynoldsburg: | 6 minutes |
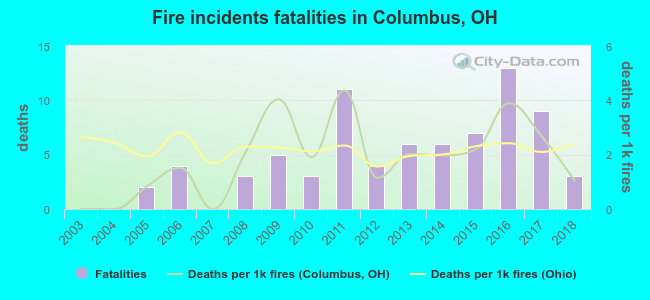 According to the reports from the years 2003 - 2018 the average number of fire-related yearly deaths is 5. The highest number of reported deaths - 13 took place in 2016, and the lowest - 0 in 2003. The data has an increasing trend.
The average number of fatalities per 1,000 fire incidents is 2. This indicator was the highest - 4 in 2011, and the lowest 0 in 2003. The trend for deaths per 1,000 incidents is rising. Compared to the state value the number of deaths per 1,000 fires is similar.
According to the reports from the years 2003 - 2018 the average number of fire-related yearly deaths is 5. The highest number of reported deaths - 13 took place in 2016, and the lowest - 0 in 2003. The data has an increasing trend.
The average number of fatalities per 1,000 fire incidents is 2. This indicator was the highest - 4 in 2011, and the lowest 0 in 2003. The trend for deaths per 1,000 incidents is rising. Compared to the state value the number of deaths per 1,000 fires is similar.
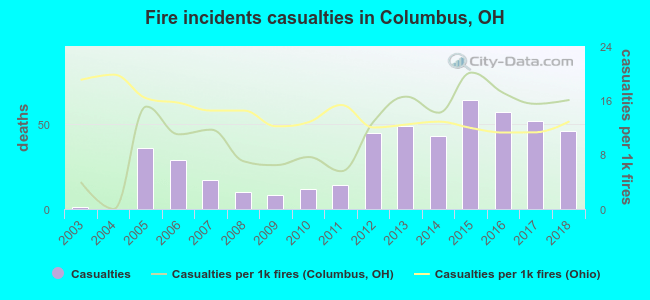 Based on the data from the years 2003 - 2018 the average number of fire-related casualties per year is 30. The highest number of injuries - 64 took place in 2015, and the lowest - 0 in 2004. The data has an increasing trend.
The average number of casualties per 1,000 fire incidents is 11. This indicator was the highest - 20 in 2015, and the lowest 0 in 2004. The trend for injuries per 1,000 incidents is growing. Compared to the Ohio value the number of injuries per 1,000 fires is about the same.
Based on the data from the years 2003 - 2018 the average number of fire-related casualties per year is 30. The highest number of injuries - 64 took place in 2015, and the lowest - 0 in 2004. The data has an increasing trend.
The average number of casualties per 1,000 fire incidents is 11. This indicator was the highest - 20 in 2015, and the lowest 0 in 2004. The trend for injuries per 1,000 incidents is growing. Compared to the Ohio value the number of injuries per 1,000 fires is about the same.Casualties per 1,000 incidents in Columbus, OH compared to nearest cities:
(Note: Based on data for all years, including only cities with at least 500 fire incidents)
| Columbus: | 13.4 |
| Upper Arlington: | 15.7 |
| Whitehall: | 9.9 |
| Gahanna: | 7.5 |
| Worthington: | 10.2 |
| Hilliard: | 12.7 |
| Grove City: | 14.1 |
| Westerville: | 15.6 |
| Reynoldsburg: | 22.3 |
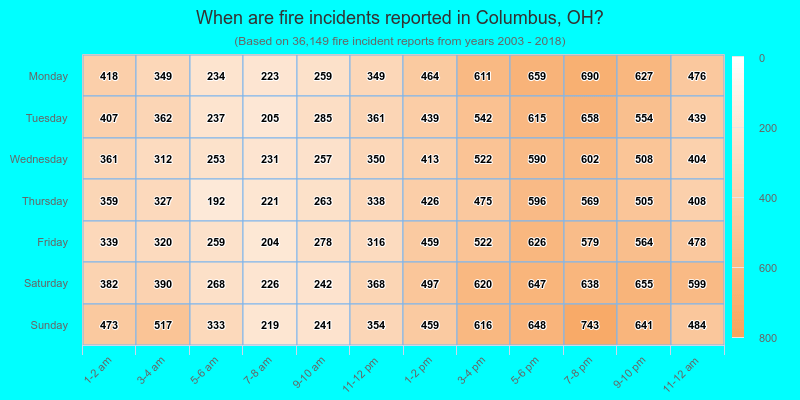
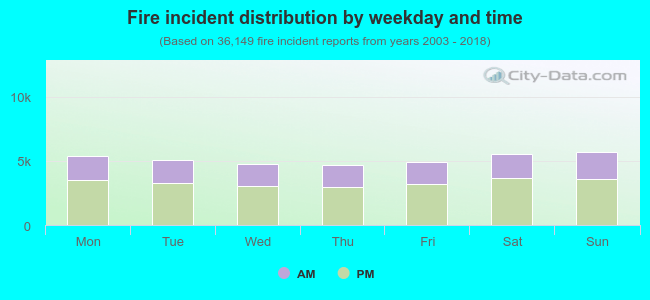 35.6% incidents where reported in the morning and 64.4% in the evening. The most fires (15.8%) took place on Sunday, and the least (12.9%) on Thursday.
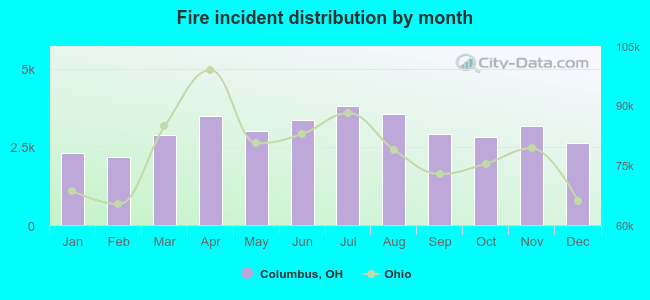 Based on the 36,149 incident reports from years 2003 - 2018 most fires (10.6%) took place during July, and the least (6.0%) in February.
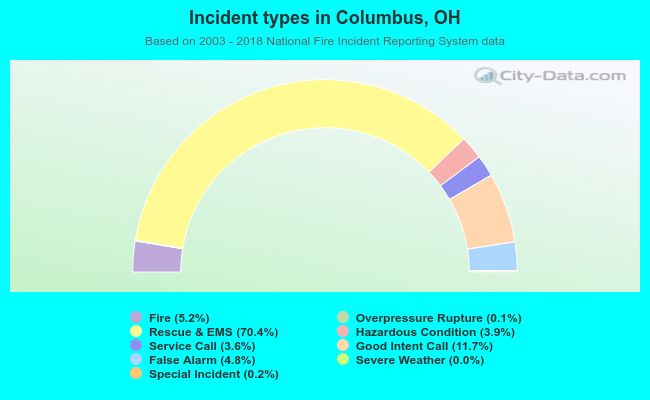 Out of all 699,950 cases reported during the years 2003 - 2018, the most belonged to the categories: Rescue & EMS (70.4%), Good Intent Call (11.7%), and Fire (5.2%).
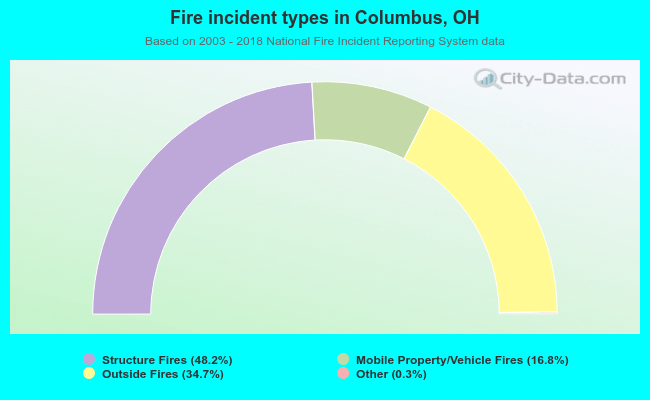 When looking into fire subcategories, the most incidents belonged to: Structure Fires (48.2%), and Outside Fires (34.7%).