Concord: Fire Incidents, North Carolina (NC)
Where are fire incidents reported in Concord, NC
Something went wrong! Please refresh the page.
| Fire incidents reported | |
|---|---|
| Sreet name | Count |
| CONCORD | 180 |
| COLD SPRINGS RD | 122 |
| CONCORD PKY | 114 |
| FLOWES STORE RD | 112 |
| CHURCH ST | 110 |
| CONCORD MILLS BLVD | 108 |
| POPLAR TENT RD | 98 |
| I 85 | 94 |
| DAVIDSON HWY | 84 |
| US INTERSTATE 85 | 76 |
| ZION CHURCH RD | 72 |
| OLD CHARLOTTE RD | 68 |
| UNION ST | 68 |
| MT PLEASANT RD | 62 |
| ODELL SCHOOL RD | 60 |
| IRISH POTATO RD | 58 |
| MIAMI CHURCH RD | 56 |
| CABARRUS AVE | 50 |
| RIMER RD | 50 |
| CENTRAL DR | 48 |
| GOLD HILL RD | 48 |
| PENNINGER RD | 48 |
| PITTS SCHOOL RD | 48 |
| BOSTWOOD LN | 44 |
| BUFFALO AVE | 42 |
| CLINE SCHOOL RD | 42 |
| MOREHEAD RD | 40 |
| GATEWAY LN | 38 |
| HARRIS ST | 36 |
| SAMUEL ADAMS CIR | 34 |
| Other | 2,223 |
2002 - 2018 National Fire Incident Reporting System (NFIRS) incidents
- Incident types reported to NFIRS in Concord, NC
- 31,64352.3%Rescue & EMS
- 10,24316.9%Good Intent Call
- 5,5919.2%Service Call
- 5,2568.7%False Alarm
- 4,3337.2%Fire
- 3,0535.0%Hazardous Condition
- 2140.4%Severe Weather
- 780.1%Overpressure Rupture
- Fire incident types reported to NFIRS in Concord, NC
- 1,75440.5%Structure Fires
- 1,57936.4%Outside Fires
- 69916.1%Mobile Property/Vehicle Fires
- 3016.9%Other
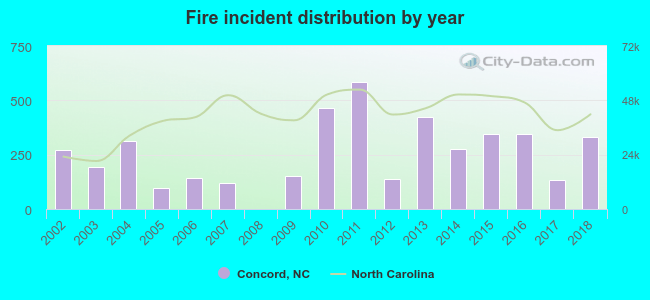 According to the data from the years 2002 - 2018 the average number of fires per year is 255. The highest number of reported fire incidents - 583 took place in 2011, and the least - 0 in 2008. The data has an increasing trend.
The average number of yearly fire incidents per 10k residents in Concord, NC compared to nearest cities:
(Note: Based on data for the last 3 years, including only cities with population 5,000 and above)
| Concord: | 31.7 |
| Kannapolis: | 24.5 |
| Harrisburg: | 21.2 |
| Davidson: | 19.2 |
| Huntersville: | 7.4 |
| Mint Hill: | 26.7 |
| Cornelius: | 14.8 |
| Mooresville: | 71.8 |
| Charlotte: | 21.2 |
 The median response time based on all reported fire incidents is 5 minutes. This is lower compared to the North Carolina median value.
The median response time in Concord, NC compared to nearest cities:
(Note: Based on data for all years, including only cities with at least 500 fire incidents)
| Concord: | 5 minutes |
| Kannapolis: | 5 minutes |
| China Grove: | 8 minutes |
| Davidson: | 7 minutes |
| Huntersville: | 6 minutes |
| Rockwell: | 8 minutes |
| Mint Hill: | 7 minutes |
| Cornelius: | 5 minutes |
| Mooresville: | 6 minutes |
 Based on the data from the years 2002 - 2018 the average number of fire-related yearly casualties is 2. The highest number of reported injuries - 10 took place in 2011, and the lowest - 0 in 2004. The data has a constant trend.
The average number of injuries per 1,000 fires is 5. This indicator was the highest - 20 in 2015, and the lowest 0 in 2004. The trend for injuries per 1,000 fires is decreasing. Compared to the state value the number of casualties per 1,000 incidents is about the same.
Based on the data from the years 2002 - 2018 the average number of fire-related yearly casualties is 2. The highest number of reported injuries - 10 took place in 2011, and the lowest - 0 in 2004. The data has a constant trend.
The average number of injuries per 1,000 fires is 5. This indicator was the highest - 20 in 2015, and the lowest 0 in 2004. The trend for injuries per 1,000 fires is decreasing. Compared to the state value the number of casualties per 1,000 incidents is about the same.Casualties per 1,000 incidents in Concord, NC compared to nearest cities:
(Note: Based on data for all years, including only cities with at least 500 fire incidents)
| Concord: | 6.7 |
| Kannapolis: | 19.0 |
| China Grove: | 0.0 |
| Davidson: | 3.3 |
| Huntersville: | 1.7 |
| Rockwell: | 0.9 |
| Mint Hill: | 1.3 |
| Cornelius: | 1.2 |
| Mooresville: | 4.0 |
 29.4% incidents where reported in the morning and 70.6% in the evening. The most fires (16.2%) took place on Saturday, and the least (12.4%) on Tuesday.
 Based on the 4,333 fire incidents from years 2002 - 2018 most fires (10.3%) took place during April, and the least (7.2%) in September.
 Out of all 60,471 cases reported during the years 2002 - 2018, the most belonged to the categories: Rescue & EMS (52.3%), Good Intent Call (16.9%), and Service Call (9.2%).
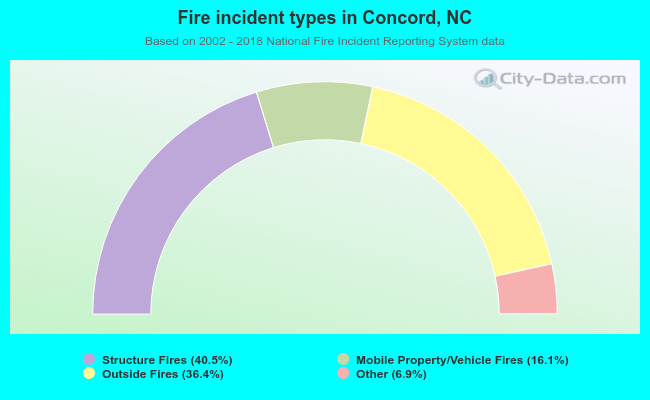 When looking into fire subcategories, the most incidents belonged to: Structure Fires (40.5%), and Outside Fires (36.4%).