Cookeville: Fire Incidents, Tennessee (TN)
Where are fire incidents reported in Cookeville, TN
Something went wrong! Please refresh the page.
| Fire incidents reported | |
|---|---|
| Sreet name | Count |
| JEFFERSON AVE | 328 |
| WILLOW AVE | 274 |
| JACKSON ST | 208 |
| SPRING ST | 176 |
| BROAD ST | 150 |
| I40 | 116 |
| DIXIE AVE | 110 |
| 10TH ST | 80 |
| BUFFALO VALLEY RD | 72 |
| WASHINGTON AVE | 72 |
| WALNUT AVE | 66 |
| INTERSTATE DR | 60 |
| MAPLE AVE | 60 |
| DODSON BRANCH HWY | 54 |
| FREEHILL RD | 46 |
| 111 HWY | 44 |
| FISK RD | 40 |
| FLEETGUARD RD | 40 |
| NEAL ST | 40 |
| STEVENS ST | 40 |
| LEE AVE | 38 |
| I-40 HWY | 34 |
| 1ST ST | 32 |
| JERE WHITSON RD | 32 |
| RIDGEDALE DR | 32 |
| SALEM RD | 32 |
| 12TH ST | 30 |
| 15TH ST | 30 |
| BUNKER HILL RD | 30 |
| DODSON BRANCH RD | 30 |
| Other | 1,448 |
2002 - 2018 National Fire Incident Reporting System (NFIRS) incidents
- Incident types reported to NFIRS in Cookeville, TN
- 7,65934.7%Rescue & EMS
- 4,93022.4%Hazardous Condition
- 3,84417.4%Fire
- 2,45311.1%False Alarm
- 1,9408.8%Good Intent Call
- 1,0314.7%Service Call
- 870.4%Overpressure Rupture
- 780.4%Special Incident
- 280.1%Severe Weather
- Fire incident types reported to NFIRS in Cookeville, TN
- 1,71544.6%Outside Fires
- 1,33834.8%Structure Fires
- 70518.3%Mobile Property/Vehicle Fires
- 862.2%Other
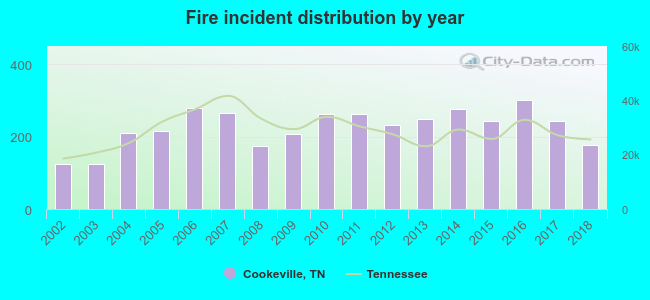 According to the data from the years 2002 - 2018 the average number of fires per year is 226. The highest number of fires - 300 took place in 2016, and the least - 123 in 2002. The data has an increasing trend.
The average number of yearly fire incidents per 10k residents in Cookeville, TN compared to nearest cities:
(Note: Based on data for the last 3 years, including only cities with population 5,000 and above)
| Cookeville: | 76.5 |
| Rickman: | 17.0 |
| Sparta: | 260.1 |
| Crossville: | 214.2 |
| McMinnville: | 87.6 |
| Fairfield Glade: | 17.2 |
| Lebanon: | 91.1 |
 The median response time based on all reported fire incidents is 6 minutes. This is similar to the state median value.
The median response time in Cookeville, TN compared to nearest cities:
(Note: Based on data for all years, including only cities with at least 500 fire incidents)
| Cookeville: | 6 minutes |
| Baxter: | 12 minutes |
| Monterey: | 12 minutes |
| Gainesboro: | 13 minutes |
| Sparta: | 9 minutes |
| Livingston: | 6 minutes |
| Smithville: | 12 minutes |
| Carthage: | 7 minutes |
| Celina: | 10 minutes |
 Based on the reports from the years 2002 - 2018 the average number of fire-related yearly deaths is 1. The highest number of deaths - 4 took place in 2005, and the lowest - 0 in 2002. The data has a growing trend.
The average number of deaths per 1,000 fires is 3. This indicator was the highest - 19 in 2005, and the lowest 0 in 2002. The trend for deaths per 1,000 fire incidents is growing. Compared to the state value the number of deaths per 1,000 fires is about the same.
Based on the reports from the years 2002 - 2018 the average number of fire-related yearly deaths is 1. The highest number of deaths - 4 took place in 2005, and the lowest - 0 in 2002. The data has a growing trend.
The average number of deaths per 1,000 fires is 3. This indicator was the highest - 19 in 2005, and the lowest 0 in 2002. The trend for deaths per 1,000 fire incidents is growing. Compared to the state value the number of deaths per 1,000 fires is about the same.Deaths per 1,000 incidents in Cookeville, TN compared to nearest cities:
(Note: Based on data for all years, including only cities with at least 2,500 fire incidents)
| Cookeville: | 3.1 |
| Sparta: | 2.5 |
| Crossville: | 2.4 |
| Lebanon: | 2.9 |
 According to the data from the years 2002 - 2018 the average number of fire-related casualties per year is 3. The highest number of injuries - 10 took place in 2016, and the lowest - 0 in 2003. The data has a rising trend.
The average number of casualties per 1,000 fire incidents is 13. This indicator was the highest - 33 in 2016, and the lowest 0 in 2003. The trend for casualties per 1,000 fire incidents is growing. Compared to the Tennessee value the number of casualties per 1,000 fires is higher.
According to the data from the years 2002 - 2018 the average number of fire-related casualties per year is 3. The highest number of injuries - 10 took place in 2016, and the lowest - 0 in 2003. The data has a rising trend.
The average number of casualties per 1,000 fire incidents is 13. This indicator was the highest - 33 in 2016, and the lowest 0 in 2003. The trend for casualties per 1,000 fire incidents is growing. Compared to the Tennessee value the number of casualties per 1,000 fires is higher.Casualties per 1,000 incidents in Cookeville, TN compared to nearest cities:
(Note: Based on data for all years, including only cities with at least 500 fire incidents)
| Cookeville: | 13.8 |
| Baxter: | 20.6 |
| Monterey: | 1.7 |
| Gainesboro: | 7.4 |
| Sparta: | 0.9 |
| Livingston: | 10.7 |
| Smithville: | 11.6 |
| Carthage: | 18.1 |
| Celina: | 12.9 |
 31.0% incidents where reported in the morning and 69.0% in the evening. The most fires (16.0%) took place on Friday, and the least (13.4%) on Thursday.
 According to the 3,844 reports from years 2002 - 2018 most fires (10.7%) took place during March, and the least (6.4%) in December.
 Out of all 22,050 cases reported during the years 2002 - 2018, the most belonged to the categories: Rescue & EMS (34.7%), Hazardous Condition (22.4%), and Fire (17.4%).
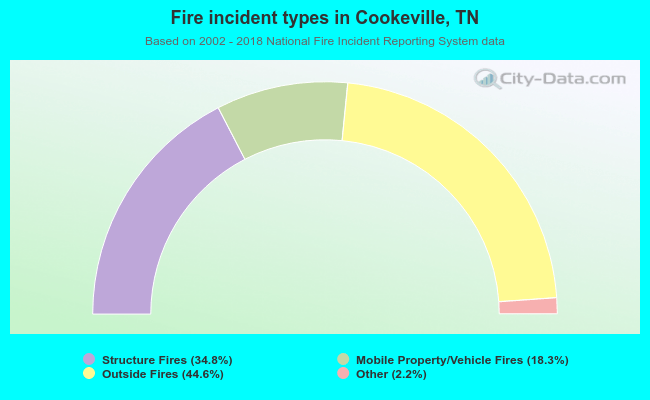 When looking into fire subcategories, the most incidents belonged to: Outside Fires (44.6%), and Structure Fires (34.8%).