Cooper City: Fire Incidents, Florida (FL)
Where are fire incidents reported in Cooper City, FL
Something went wrong! Please refresh the page.
| Fire incidents reported | |
|---|---|
| Sreet name | Count |
| STIRLING RD | 106 |
| FLAMINGO RD | 68 |
| GRIFFIN RD | 68 |
| SHERIDAN ST | 58 |
| HIATUS RD | 28 |
| 52ND ST | 26 |
| PINE ISLAND RD | 22 |
| 88TH TER | 20 |
| 91ST AVE | 20 |
| 53RD ST | 16 |
| 90TH AVE | 16 |
| 92ND TER | 14 |
| 49TH PL | 12 |
| 49TH ST | 12 |
| 52ND CT | 12 |
| 59TH ST | 12 |
| 89TH AVE | 12 |
| STONEBRIDGE PKY | 12 |
| 106TH AVE | 10 |
| 35TH ST | 10 |
| 51ST ST | 10 |
| 59TH CT | 10 |
| 87TH AVE | 10 |
| 90TH WAY | 10 |
| 95TH AVE | 10 |
| SARATOGA DR | 10 |
| SOLANO AVE | 10 |
| 101ST AVE | 8 |
| 115TH AVE | 8 |
| 50TH ST | 8 |
2004 - 2018 National Fire Incident Reporting System (NFIRS) incidents
- Incident types reported to NFIRS in Cooper City, FL
- 7,53862.4%Rescue & EMS
- 1,38111.4%Good Intent Call
- 9738.1%Service Call
- 8407.0%False Alarm
- 7095.9%Hazardous Condition
- 6305.2%Fire
- Fire incident types reported to NFIRS in Cooper City, FL
- 26341.7%Structure Fires
- 23337.0%Outside Fires
- 9815.6%Mobile Property/Vehicle Fires
- 365.7%Other
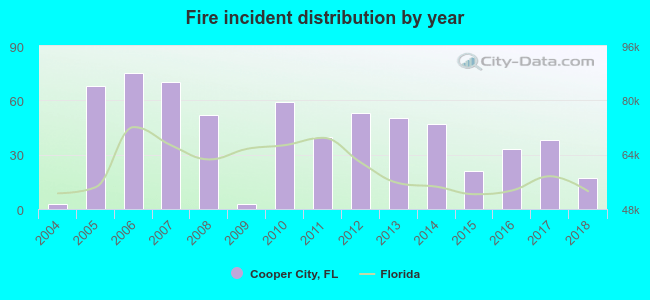 Based on the data from the years 2004 - 2018 the average number of fire incidents per year is 42. The highest number of reported fires - 75 took place in 2006, and the least - 3 in 2004. The data has a growing trend.
The average number of yearly fire incidents per 10k residents in Cooper City, FL compared to nearest cities:
(Note: Based on data for the last 3 years, including only cities with population 5,000 and above)
| Cooper City: | 8.4 |
| Davie: | 21.9 |
| Pembroke Pines: | 7.4 |
| Southwest Ranches: | 40.8 |
| Miramar: | 10.3 |
| Plantation: | 10.4 |
| West Park: | 27.7 |
| Hollywood: | 20.1 |
| Weston: | 8.4 |
 The median response time based on all reported fire incidents is 6 minutes. This is about the same as the Florida median value.
The median response time in Cooper City, FL compared to nearest cities:
(Note: Based on data for all years, including only cities with at least 500 fire incidents)
| Cooper City: | 6 minutes |
| Davie: | 7 minutes |
| Pembroke Pines: | 5 minutes |
| Southwest Ranches: | 7 minutes |
| Miramar: | 6 minutes |
| Plantation: | 7 minutes |
| West Park: | 5 minutes |
| Miami Gardens: | 6 minutes |
| Hollywood: | 6 minutes |
 Based on the data from the years 2004 - 2018 the average number of fire-related yearly casualties is 1. The highest number of reported injuries - 4 took place in 2010, and the lowest - 0 in 2004. The data has a constant trend.
The average number of casualties per 1,000 fire incidents is 21. This indicator was the highest - 68 in 2010, and the lowest 0 in 2004. The trend for casualties per 1,000 fires is increasing. Compared to the state value the number of injuries per 1,000 fires is much higher.
Based on the data from the years 2004 - 2018 the average number of fire-related yearly casualties is 1. The highest number of reported injuries - 4 took place in 2010, and the lowest - 0 in 2004. The data has a constant trend.
The average number of casualties per 1,000 fire incidents is 21. This indicator was the highest - 68 in 2010, and the lowest 0 in 2004. The trend for casualties per 1,000 fires is increasing. Compared to the state value the number of injuries per 1,000 fires is much higher.Casualties per 1,000 incidents in Cooper City, FL compared to nearest cities:
(Note: Based on data for all years, including only cities with at least 500 fire incidents)
| Cooper City: | 28.6 |
| Davie: | 14.2 |
| Pembroke Pines: | 31.2 |
| Southwest Ranches: | 3.0 |
| Miramar: | 17.8 |
| Plantation: | 6.6 |
| West Park: | 18.9 |
| Miami Gardens: | 0.0 |
| Hollywood: | 17.4 |
 24.9% incidents where reported in the morning and 75.1% in the evening. The most fires (17.6%) took place on Saturday, and the least (11.4%) on Tuesday.
 According to the 630 reports from years 2004 - 2018 most fires (10.8%) took place during January, and the least (5.2%) in September.
 Out of all 12,080 cases reported during the years 2004 - 2018, the most belonged to the categories: Rescue & EMS (62.4%), Good Intent Call (11.4%), and Service Call (8.1%).
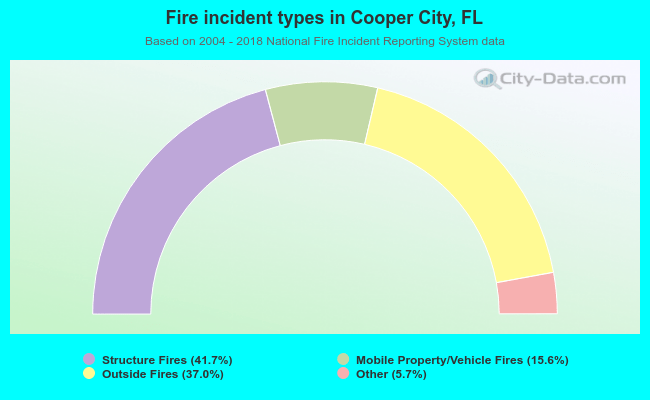 When looking into fire subcategories, the most incidents belonged to: Structure Fires (41.7%), and Outside Fires (37.0%).