Coupeville: Fire Incidents, Washington (WA)
Where are fire incidents reported in Coupeville, WA
Something went wrong! Please refresh the page.
|
| |||||||||||||||||||||||||||||||||||||||||||||||||||||||||||||||||||||||||||||||||||||||||||||||||||||||||||||
2002 - 2018 National Fire Incident Reporting System (NFIRS) incidents
- Incident types reported to NFIRS in Coupeville, WA
- 3,87152.4%Rescue & EMS
- 1,16615.8%Good Intent Call
- 6568.9%Hazardous Condition
- 6148.3%Service Call
- 4966.7%Fire
- 3745.1%False Alarm
- 1742.4%Special Incident
- 370.5%Severe Weather
- Fire incident types reported to NFIRS in Coupeville, WA
- 17936.1%Outside Fires
- 17435.1%Structure Fires
- 7615.3%Mobile Property/Vehicle Fires
- 6713.5%Other
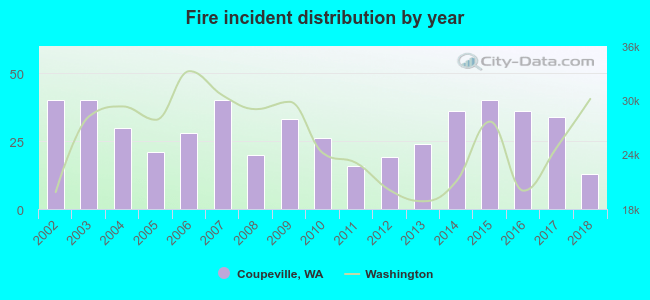 According to the data from the years 2002 - 2018 the average number of fires per year is 29. The highest number of fire incidents - 40 took place in 2002, and the least - 13 in 2018. The data has a declining trend.
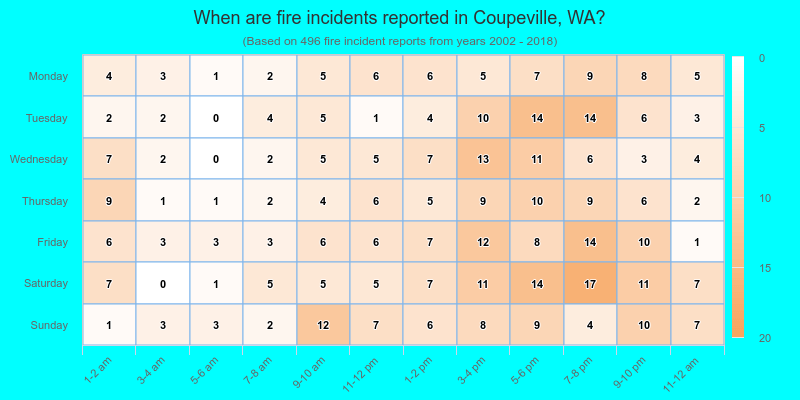
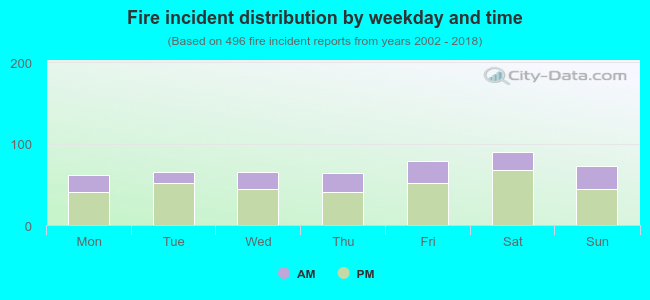 31.7% incidents where reported in the morning and 68.3% in the evening. The most fires (18.1%) took place on Saturday, and the least (12.3%) on Monday.
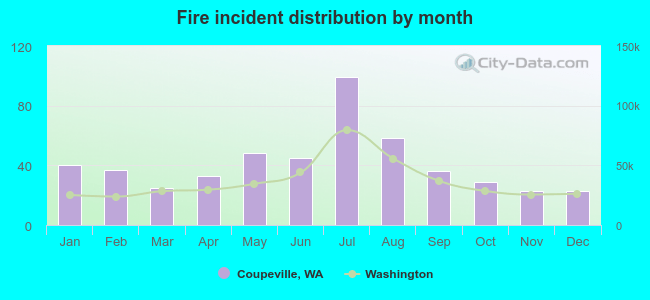 Based on the 496 fire incident reports from years 2002 - 2018 most fires (20.0%) took place during July, and the least (4.6%) in November.
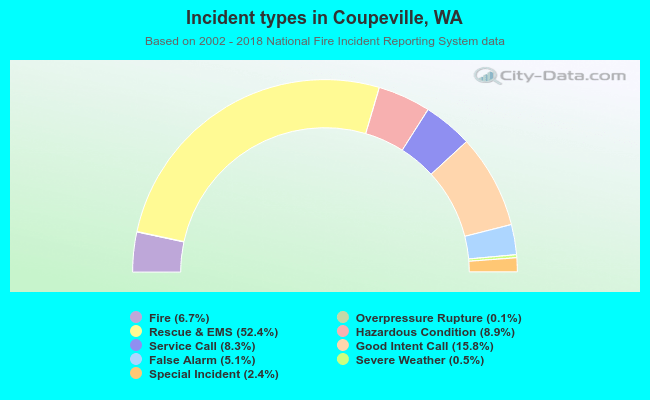 Out of all 7,393 cases reported during the years 2002 - 2018, the most belonged to the categories: Rescue & EMS (52.4%), Good Intent Call (15.8%), and Hazardous Condition (8.9%).
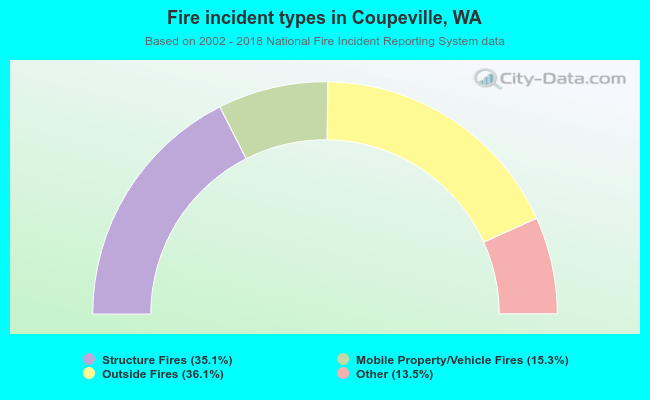 When looking into fire subcategories, the most reports belonged to: Outside Fires (36.1%), and Structure Fires (35.1%).