Coventry: Fire Incidents, Connecticut (CT)
Where are fire incidents reported in Coventry, CT
Something went wrong! Please refresh the page.
| Fire incidents reported | |
|---|---|
| Sreet name | Count |
| MAIN STREET | 162 |
| OUT OF TOWN | 74 |
| SOUTH STREET | 72 |
| MAIN ST | 56 |
| BOSTON TURNPIKE | 48 |
| NORTH RIVER ROAD | 40 |
| DALY ROAD | 32 |
| SOUTH ST | 32 |
| FLANDERS ROAD | 28 |
| GRANT HILL ROAD | 28 |
| HEMLOCK POINT DRIVE | 26 |
| STONEHOUSE ROAD | 24 |
| IRELAND DRIVE | 20 |
| STANDISH ROAD | 20 |
| BREAD & MILK STREET | 18 |
| MERROW ROAD | 18 |
| WOODMONT DRIVE | 18 |
| ECHO ROAD | 16 |
| LAKEVIEW DRIVE | 16 |
| ROOT ROAD | 16 |
| BUNKER HILL ROAD | 14 |
| DUNN ROAD | 14 |
| GERALDINE DRIVE | 14 |
| HIGH STREET | 14 |
| LAKE STREET | 14 |
| MORIN AVENUE | 14 |
| PUCKER STREET | 14 |
| SAM GREEN ROAD | 14 |
| WOODLAND ROAD | 14 |
| AVERY SHORES | 12 |
| Other | 142 |
2002 - 2018 National Fire Incident Reporting System (NFIRS) incidents
- Incident types reported to NFIRS in Coventry, CT
- 1,20730.1%Rescue & EMS
- 1,07026.7%Hazardous Condition
- 1,04426.0%Fire
- 3308.2%Good Intent Call
- 2155.4%Service Call
- 1243.1%False Alarm
- 100.2%Special Incident
- 60.1%Severe Weather
- Fire incident types reported to NFIRS in Coventry, CT
- 65662.8%Structure Fires
- 24423.4%Outside Fires
- 908.6%Mobile Property/Vehicle Fires
- 545.2%Other
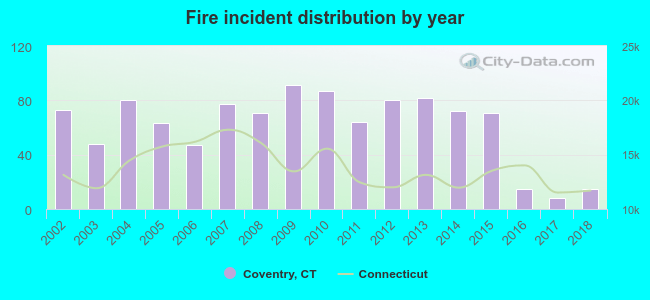 Based on the data from the years 2002 - 2018 the average number of fires per year is 61. The highest number of fires - 91 took place in 2009, and the least - 8 in 2017. The data has a decreasing trend.
The average number of yearly fire incidents per 10k residents in Coventry, CT compared to nearest cities:
(Note: Based on data for the last 3 years, including only cities with population 5,000 and above)
| Coventry: | 10.2 |
| Storrs: | 26.1 |
| Mansfield: | 6.8 |
| Columbia: | 41.3 |
| Tolland: | 20.2 |
| Willimantic: | 41.5 |
| Willington: | 14.3 |
| Vernon: | 18.4 |
| Windham: | 5.9 |
 The median response time based on all reported fire incidents is 7 minutes. This is higher than the Connecticut median value.
The median response time in Coventry, CT compared to nearest cities:
(Note: Based on data for all years, including only cities with at least 500 fire incidents)
| Coventry: | 7 minutes |
| Tolland: | 8 minutes |
| Willimantic: | 4 minutes |
| Vernon: | 5 minutes |
| Manchester: | 4 minutes |
| Ellington: | 6 minutes |
| Lebanon: | 12 minutes |
| South Windsor: | 7 minutes |
| Glastonbury: | 6 minutes |
 Based on the data from the years 2002 - 2018 the average number of fire-related casualties per year is 1. The highest number of casualties - 3 took place in 2010, and the lowest - 0 in 2002. The data has a constant trend.
The average number of casualties per 1,000 fires is 8. This indicator was the highest - 34 in 2010, and the lowest 0 in 2002. The trend for casualties per 1,000 incidents is constant. Compared to the state value the number of casualties per 1,000 fire incidents is lower.
Based on the data from the years 2002 - 2018 the average number of fire-related casualties per year is 1. The highest number of casualties - 3 took place in 2010, and the lowest - 0 in 2002. The data has a constant trend.
The average number of casualties per 1,000 fires is 8. This indicator was the highest - 34 in 2010, and the lowest 0 in 2002. The trend for casualties per 1,000 incidents is constant. Compared to the state value the number of casualties per 1,000 fire incidents is lower.Casualties per 1,000 incidents in Coventry, CT compared to nearest cities:
(Note: Based on data for all years, including only cities with at least 500 fire incidents)
| Coventry: | 9.6 |
| Tolland: | 0.0 |
| Willimantic: | 23.8 |
| Vernon: | 9.4 |
| Manchester: | 28.9 |
| Ellington: | 9.8 |
| Lebanon: | 8.0 |
| South Windsor: | 7.0 |
| Glastonbury: | 16.7 |
 32.3% incidents where reported in the morning and 67.7% in the evening. The most fires (17.3%) took place on Tuesday, and the least (12.1%) on Wednesday.
 According to the 1,044 reports from years 2002 - 2018 most fires (12.4%) took place during April, and the least (4.6%) in August.
 Out of all 4,008 cases reported during the years 2002 - 2018, the most belonged to the categories: Rescue & EMS (30.1%), Hazardous Condition (26.7%), and Fire (26.0%).
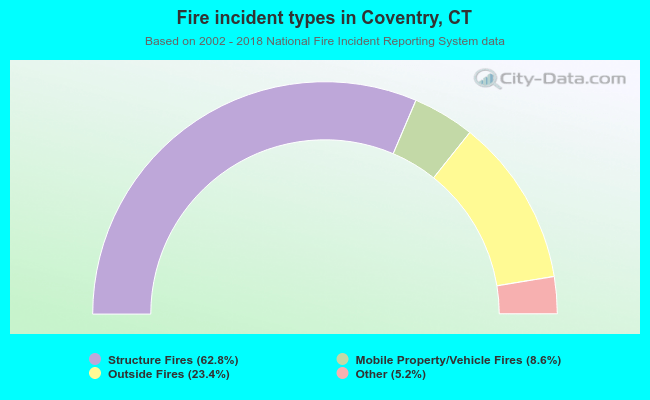 When looking into fire subcategories, the most incidents belonged to: Structure Fires (62.8%), and Outside Fires (23.4%).