Crystal: Fire Incidents, Minnesota (MN)
Where are fire incidents reported in Crystal, MN
Something went wrong! Please refresh the page.
| Fire incidents reported | |
|---|---|
| Sreet name | Count |
| DOUGLAS DR | 172 |
| WEST BROADWAY AVE | 120 |
| SUMTER AVE | 60 |
| 36TH AVE | 54 |
| 32ND AVE | 50 |
| BASS LAKE RD | 48 |
| WELCOME AVE | 42 |
| KENTUCKY AVE | 40 |
| 56TH AVE | 38 |
| LOUISIANA AVE | 38 |
| HAMPSHIRE AVE | 36 |
| WINNETKA AVE | 36 |
| JERSEY AVE | 30 |
| 54TH AVE | 28 |
| 55TH AVE | 26 |
| BRUNSWICK AVE | 26 |
| IDAHO AVE | 26 |
| LAKELAND AVE | 26 |
| 47TH AVE | 24 |
| WEST BROADWAY | 24 |
| 42ND AVE | 22 |
| 53RD AVE | 22 |
| ADAIR AVE | 22 |
| FLORIDA AVE | 22 |
| MARYLAND AVE | 22 |
| 34TH AVE | 20 |
| 35TH AVE | 20 |
| EDGEWOOD AVE | 20 |
| HANSON CT | 20 |
| LEE AVE | 20 |
2002 - 2018 National Fire Incident Reporting System (NFIRS) incidents
- Incident types reported to NFIRS in Crystal, MN
- 2,17830.2%Hazardous Condition
- 1,98727.5%Rescue & EMS
- 91612.7%Service Call
- 91512.7%Fire
- 6158.5%False Alarm
- 5918.2%Good Intent Call
- 110.2%Overpressure Rupture
- Fire incident types reported to NFIRS in Crystal, MN
- 48252.7%Structure Fires
- 23926.1%Outside Fires
- 15717.2%Mobile Property/Vehicle Fires
- 374.0%Other
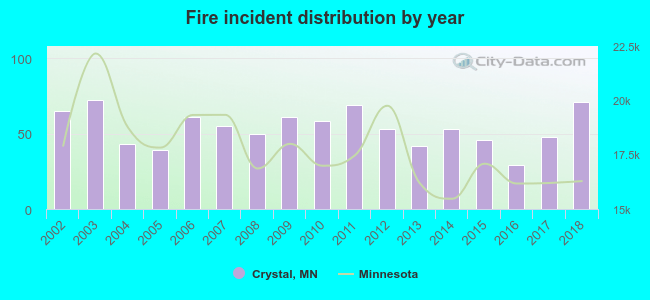 According to the data from the years 2002 - 2018 the average number of fire incidents per year is 54. The highest number of reported fire incidents - 72 took place in 2003, and the least - 29 in 2016. The data has a growing trend.
The average number of yearly fire incidents per 10k residents in Crystal, MN compared to nearest cities:
(Note: Based on data for the last 3 years, including only cities with population 5,000 and above)
| Crystal: | 21.8 |
| New Hope: | 25.3 |
| Robbinsdale: | 31.4 |
| Golden Valley: | 25.9 |
| Brooklyn Center: | 38.6 |
| Brooklyn Park: | 30.2 |
| Plymouth: | 26.9 |
| Columbia Heights: | 33.0 |
| Fridley: | 45.8 |
 The median response time based on all reported fire incidents is 5 minutes. This is lower compared to the Minnesota median value.
The median response time in Crystal, MN compared to nearest cities:
(Note: Based on data for all years, including only cities with at least 500 fire incidents)
| Crystal: | 5 minutes |
| New Hope: | 5 minutes |
| Robbinsdale: | 6 minutes |
| Golden Valley: | 7 minutes |
| Brooklyn Center: | 6 minutes |
| Brooklyn Park: | 5 minutes |
| Plymouth: | 8 minutes |
| Columbia Heights: | 5 minutes |
| Fridley: | 7 minutes |
 According to the reports from the years 2002 - 2018 the average number of fire-related yearly casualties is 1. The highest number of injuries - 4 took place in 2002, and the lowest - 0 in 2003. The data has a declining trend.
The average number of casualties per 1,000 fires is 12. This indicator was the highest - 62 in 2002, and the lowest 0 in 2003. The trend for injuries per 1,000 incidents is decreasing. Compared to the Minnesota value the number of casualties per 1,000 fire incidents is higher.
According to the reports from the years 2002 - 2018 the average number of fire-related yearly casualties is 1. The highest number of injuries - 4 took place in 2002, and the lowest - 0 in 2003. The data has a declining trend.
The average number of casualties per 1,000 fires is 12. This indicator was the highest - 62 in 2002, and the lowest 0 in 2003. The trend for injuries per 1,000 incidents is decreasing. Compared to the Minnesota value the number of casualties per 1,000 fire incidents is higher.Casualties per 1,000 incidents in Crystal, MN compared to nearest cities:
(Note: Based on data for all years, including only cities with at least 500 fire incidents)
| Crystal: | 13.1 |
| New Hope: | 11.0 |
| Robbinsdale: | 1.7 |
| Golden Valley: | 2.1 |
| Brooklyn Center: | 6.3 |
| Brooklyn Park: | 11.2 |
| Plymouth: | 18.6 |
| Columbia Heights: | 28.5 |
| Fridley: | 14.3 |
 29.5% incidents where reported in the morning and 70.5% in the evening. The most fires (15.7%) took place on Saturday, and the least (9.9%) on Wednesday.
 According to the 915 incident reports from years 2002 - 2018 most fires (12.0%) took place during July, and the least (6.3%) in March.
 Out of all 7,221 cases reported during the years 2002 - 2018, the most belonged to the categories: Hazardous Condition (30.2%), Rescue & EMS (27.5%), and Service Call (12.7%).
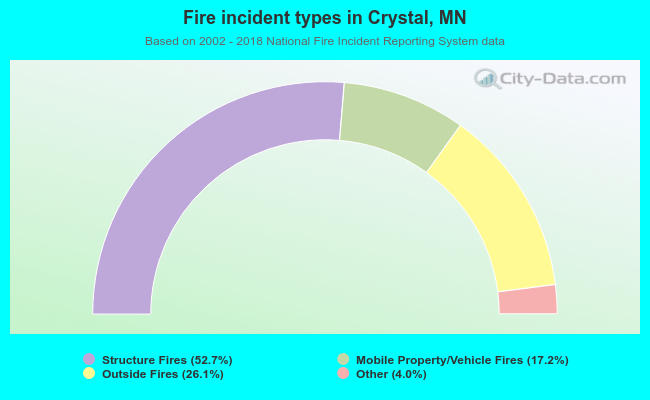 When looking into fire subcategories, the most reports belonged to: Structure Fires (52.7%), and Outside Fires (26.1%).