Danville: Fire Incidents, Pennsylvania (PA)
Where are fire incidents reported in Danville, PA
Something went wrong! Please refresh the page.
|
| |||||||||||||||||||||||||||||||||||||||||||||||||||||||||||||||||||||||||||||||||||||||||||||||||||||||||||||
| Other | 41 | |||||||||||||||||||||||||||||||||||||||||||||||||||||||||||||||||||||||||||||||||||||||||||||||||||||||||||||
2003 - 2018 National Fire Incident Reporting System (NFIRS) incidents
- Incident types reported to NFIRS in Danville, PA
- 34939.4%Fire
- 23626.7%Hazardous Condition
- 16218.3%Rescue & EMS
- 687.7%False Alarm
- 374.2%Good Intent Call
- 283.2%Service Call
- 40.5%Special Incident
- 10.1%Overpressure Rupture
- Fire incident types reported to NFIRS in Danville, PA
- 19255.0%Structure Fires
- 10229.2%Outside Fires
- 4412.6%Mobile Property/Vehicle Fires
- 113.2%Other
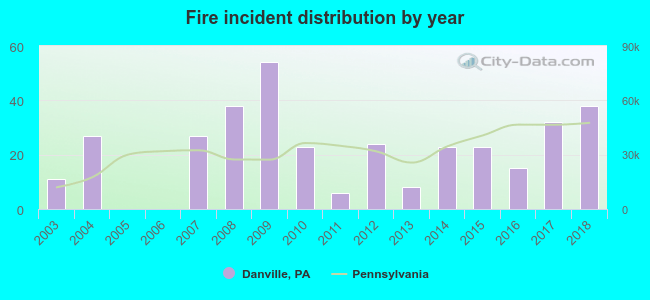 Based on the data from the years 2003 - 2018 the average number of fires per year is 22. The highest number of fire incidents - 54 took place in 2009, and the least - 0 in 2005. The data has a rising trend.
 29.5% incidents where reported in the morning and 70.5% in the evening. The most fires (18.1%) took place on Sunday, and the least (11.2%) on Tuesday.
 According to the 349 fire incidents from years 2003 - 2018 most fires (16.6%) took place during March, and the least (2.6%) in December.
 Out of all 885 cases reported during the years 2003 - 2018, the most belonged to the categories: Fire (39.4%), Hazardous Condition (26.7%), and Rescue & EMS (18.3%).
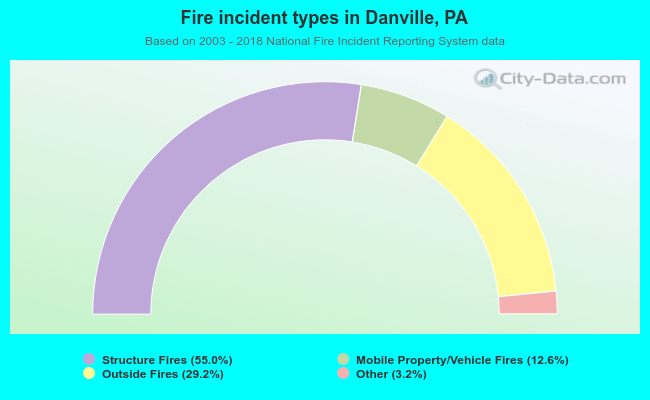 When looking into fire subcategories, the most reports belonged to: Structure Fires (55.0%), and Outside Fires (29.2%).