Deerfield: Fire Incidents, Illinois (IL)
Where are fire incidents reported in Deerfield, IL
Something went wrong! Please refresh the page.
| Fire incidents reported | |
|---|---|
| Sreet name | Count |
| WAUKEGAN RD | 172 |
| LAKE COOK RD | 140 |
| DEERFIELD RD | 62 |
| WILMOT RD | 58 |
| I-94 (NB) EXPY | 56 |
| I94EB EXPY | 34 |
| I-94 (SB) EXPY | 30 |
| I94WB EXPY | 26 |
| INVERRARY LN | 22 |
| KELBURN RD | 22 |
| SMOKE TREE RD | 20 |
| CENTRAL AVE | 18 |
| LINDEN AVE | 18 |
| PINE ST | 16 |
| SPRINGFIELD AV | 16 |
| GARDEN CT | 12 |
| HACKBERRY RD | 12 |
| BIRCH ST | 10 |
| DARTMOUTH LN | 10 |
| FERNDALE RD | 10 |
| GREENWOOD AVE | 10 |
| HAZEL AVE | 10 |
| INVERARRY LN | 10 |
| JONQUIL TER | 10 |
| OSTERMAN AV | 10 |
| PFINGSTEN RD | 10 |
| RAMSAY RD | 10 |
| TRISTATE TW | 10 |
| WARWICK RD | 10 |
| CASTLEWOOD LN | 8 |
2002 - 2018 National Fire Incident Reporting System (NFIRS) incidents
- Incident types reported to NFIRS in Deerfield, IL
- 6,62344.4%Rescue & EMS
- 3,00820.2%False Alarm
- 1,94313.0%Hazardous Condition
- 1,3479.0%Service Call
- 1,1857.9%Good Intent Call
- 7825.2%Fire
- 180.1%Overpressure Rupture
- Fire incident types reported to NFIRS in Deerfield, IL
- 36446.5%Structure Fires
- 21928.0%Outside Fires
- 17021.7%Mobile Property/Vehicle Fires
- 293.7%Other
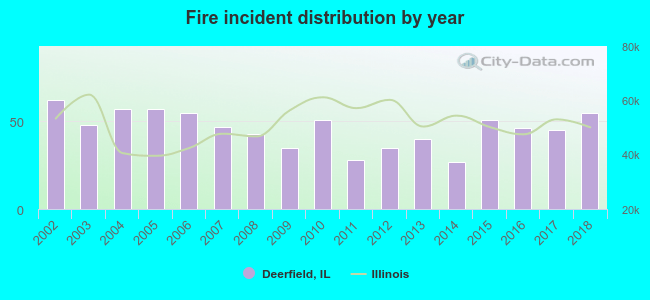 According to the data from the years 2002 - 2018 the average number of fires per year is 46. The highest number of reported fires - 62 took place in 2002, and the least - 27 in 2014. The data has a decreasing trend.
The average number of yearly fire incidents per 10k residents in Deerfield, IL compared to nearest cities:
(Note: Based on data for the last 3 years, including only cities with population 5,000 and above)
| Deerfield: | 26.5 |
| Highland Park: | 14.4 |
| Northbrook: | 21.9 |
| Highwood: | 11.8 |
| Lincolnshire: | 47.1 |
| Lake Forest: | 29.4 |
| Wheeling: | 19.4 |
| Glencoe: | 7.8 |
| Buffalo Grove: | 20.4 |
 The median response time based on all reported fire incidents is 5 minutes. This is about the same as the Illinois median value.
The median response time in Deerfield, IL compared to nearest cities:
(Note: Based on data for all years, including only cities with at least 500 fire incidents)
| Deerfield: | 5 minutes |
| Highland Park: | 4 minutes |
| Northbrook: | 5 minutes |
| Lincolnshire: | 4 minutes |
| Lake Forest: | 6 minutes |
| Wheeling: | 5 minutes |
| Buffalo Grove: | 5 minutes |
| Prospect Heights: | 5 minutes |
| Glenview: | 5 minutes |
 According to the data from the years 2002 - 2018 the average number of fire-related casualties per year is 1. The highest number of injuries - 6 took place in 2012, and the lowest - 0 in 2003. The data has a constant trend.
The average number of injuries per 1,000 fires is 19. This indicator was the highest - 171 in 2012, and the lowest 0 in 2003. The trend for casualties per 1,000 fires is increasing. Compared to the Illinois value the number of casualties per 1,000 fire incidents is higher.
According to the data from the years 2002 - 2018 the average number of fire-related casualties per year is 1. The highest number of injuries - 6 took place in 2012, and the lowest - 0 in 2003. The data has a constant trend.
The average number of injuries per 1,000 fires is 19. This indicator was the highest - 171 in 2012, and the lowest 0 in 2003. The trend for casualties per 1,000 fires is increasing. Compared to the Illinois value the number of casualties per 1,000 fire incidents is higher.Casualties per 1,000 incidents in Deerfield, IL compared to nearest cities:
(Note: Based on data for all years, including only cities with at least 500 fire incidents)
| Deerfield: | 16.6 |
| Highland Park: | 15.8 |
| Northbrook: | 17.2 |
| Lincolnshire: | 8.4 |
| Lake Forest: | 27.7 |
| Wheeling: | 57.3 |
| Buffalo Grove: | 19.4 |
| Prospect Heights: | 20.1 |
| Glenview: | 17.9 |
 29.2% incidents where reported in the morning and 70.8% in the evening. The most fires (15.5%) took place on Monday, and the least (12.8%) on Thursday.
 Based on the 782 fire incidents from years 2002 - 2018 most fires (11.3%) took place during June, and the least (5.0%) in March.
 Out of all 14,912 cases reported during the years 2002 - 2018, the most belonged to the categories: Rescue & EMS (44.4%), False Alarm (20.2%), and Hazardous Condition (13.0%).
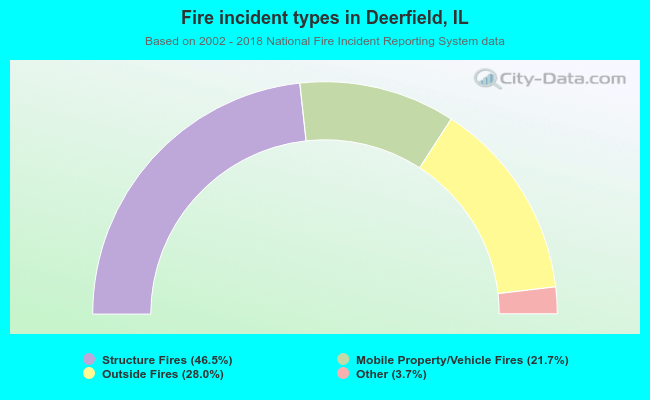 When looking into fire subcategories, the most reports belonged to: Structure Fires (46.5%), and Outside Fires (28.0%).