Derby: Fire Incidents, Connecticut (CT)
Where are fire incidents reported in Derby, CT
Something went wrong! Please refresh the page.
| Fire incidents reported | |
|---|---|
| Sreet name | Count |
| NEW HAVEN AVE | 168 |
| CAROLINE ST | 106 |
| PERSHING DR | 96 |
| ROOSEVELT DR | 74 |
| DERBY AVE | 72 |
| DIVISION ST | 70 |
| HAWTHORNE AVE | 66 |
| MAIN ST | 58 |
| SEYMOUR AVE | 54 |
| OLIVIA ST | 52 |
| MINERVA ST | 44 |
| ELIZABETH ST | 40 |
| HAWKINS ST | 40 |
| ROUTE 8 | 36 |
| ACADEMY HILL RD | 32 |
| NUTMEG AVE | 32 |
| ANSON ST | 30 |
| SILVER HILL RD | 30 |
| CHATFIELD ST | 24 |
| BURTVILLE AVE | 22 |
| MOUNT PLEASANT ST | 22 |
| SHAGBARK DR | 20 |
| PARK AVE | 18 |
| SUMMITT ST | 18 |
| HIGH ST | 16 |
| INDIAN AVE | 16 |
| SENTINEL HILL RD | 16 |
| SIXTH ST | 16 |
| SMITH ST | 16 |
| EMMETT AVE | 14 |
2002 - 2018 National Fire Incident Reporting System (NFIRS) incidents
- Incident types reported to NFIRS in Derby, CT
- 2,57249.7%Hazardous Condition
- 97918.9%Fire
- 80915.6%False Alarm
- 2815.4%Rescue & EMS
- 2645.1%Service Call
- 2104.1%Good Intent Call
- 390.8%Severe Weather
- 120.2%Overpressure Rupture
- 100.2%Special Incident
- Fire incident types reported to NFIRS in Derby, CT
- 42143.0%Outside Fires
- 36937.7%Structure Fires
- 13613.9%Mobile Property/Vehicle Fires
- 535.4%Other
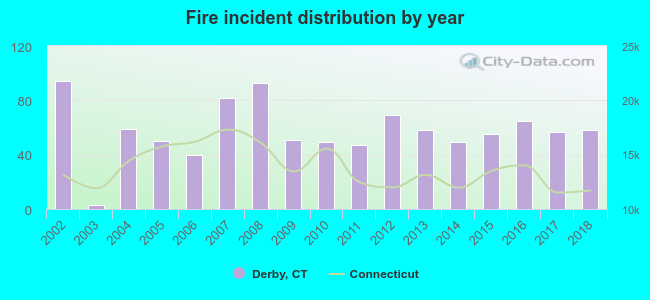 Based on the data from the years 2002 - 2018 the average number of fire incidents per year is 58. The highest number of reported fire incidents - 94 took place in 2002, and the least - 3 in 2003. The data has a dropping trend.
The average number of yearly fire incidents per 10k residents in Derby, CT compared to nearest cities:
(Note: Based on data for the last 3 years, including only cities with population 5,000 and above)
| Derby: | 47.0 |
| Ansonia: | 49.2 |
| Shelton: | 16.1 |
| Woodbridge: | 51.2 |
| Orange: | 34.2 |
| Seymour: | 29.4 |
| Riverside: | 18.6 |
| West Haven: | 47.2 |
| Monroe: | 45.5 |
 The median response time based on all reported fire incidents is 3 minutes. This is lower compared to the Connecticut median value.
The median response time in Derby, CT compared to nearest cities:
(Note: Based on data for all years, including only cities with at least 500 fire incidents)
| Derby: | 3 minutes |
| Ansonia: | 4 minutes |
| Shelton: | 7 minutes |
| Orange: | 5 minutes |
| Seymour: | 5 minutes |
| West Haven: | 4 minutes |
| Monroe: | 6 minutes |
| Milford: | 5 minutes |
| Oxford: | 6 minutes |
 According to the data from the years 2002 - 2018 the average number of fire-related yearly casualties is 1. The highest number of reported casualties - 5 took place in 2004, and the lowest - 0 in 2003. The data has a decreasing trend.
The average number of injuries per 1,000 fire incidents is 12. This indicator was the highest - 85 in 2004, and the lowest 0 in 2003. The trend for injuries per 1,000 fire incidents is dropping. Compared to the Connecticut value the number of casualties per 1,000 incidents is higher.
According to the data from the years 2002 - 2018 the average number of fire-related yearly casualties is 1. The highest number of reported casualties - 5 took place in 2004, and the lowest - 0 in 2003. The data has a decreasing trend.
The average number of injuries per 1,000 fire incidents is 12. This indicator was the highest - 85 in 2004, and the lowest 0 in 2003. The trend for injuries per 1,000 fire incidents is dropping. Compared to the Connecticut value the number of casualties per 1,000 incidents is higher.
 25.4% incidents where reported in the morning and 74.6% in the evening. The most fires (16.8%) took place on Sunday, and the least (12.6%) on Tuesday.
 Based on the 979 fire incidents from years 2002 - 2018 most fires (13.2%) took place during April, and the least (5.7%) in October.
 Out of all 5,176 cases reported during the years 2002 - 2018, the most belonged to the categories: Hazardous Condition (49.7%), Fire (18.9%), and False Alarm (15.6%).
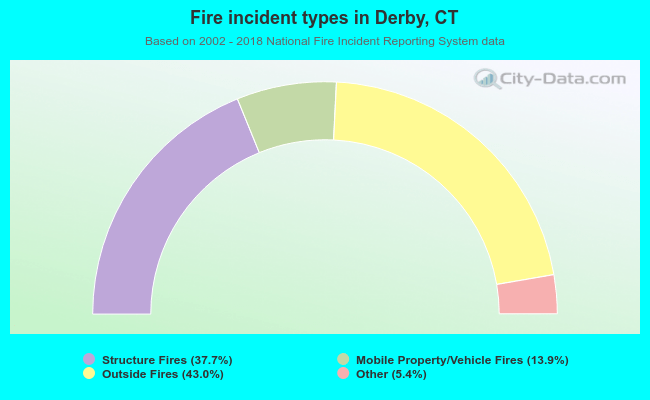 When looking into fire subcategories, the most reports belonged to: Outside Fires (43.0%), and Structure Fires (37.7%).