Easley: Fire Incidents, South Carolina (SC)
Where are fire incidents reported in Easley, SC
Something went wrong! Please refresh the page.
| Fire incidents reported | |
|---|---|
| Sreet name | Count |
| CALHOUN MEMORIAL HWY | 138 |
| MAIN ST | 88 |
| PELZER HWY | 72 |
| CALHOUN MEM HWY | 60 |
| FARRS BRIDGE RD | 58 |
| ROLLING HILLS CIR | 58 |
| DACUSVILLE HWY | 46 |
| CRESTVIEW RD | 42 |
| POWDERSVILLE RD | 42 |
| CALHOUN MEMORIAL HIGH | 36 |
| SHENANDOAH DR | 36 |
| BRUSHY CREEK RD | 32 |
| SALUDA DAM RD | 30 |
| CALHOUN MEM. HWY | 28 |
| OLD PENDLETON RD | 28 |
| PENDLETON ST | 26 |
| THREE BRIDGES RD | 26 |
| EARLS BRIDGE RD | 24 |
| HESTER STORE RD | 24 |
| HIGHWAY 153 | 24 |
| SITTON HILL RD | 24 |
| CHURCH RD | 22 |
| COLONIAL DR | 22 |
| JAMESON RD | 22 |
| OLD LIBERTY RD | 22 |
| RIVERSTONE CT | 22 |
| WALLACE DR | 22 |
| ANDREA CIR | 20 |
| HIGHLAND RD | 20 |
| JAMES RD | 20 |
| Other | 1,451 |
2004 - 2018 National Fire Incident Reporting System (NFIRS) incidents
- Incident types reported to NFIRS in Easley, SC
- 3,33025.2%Rescue & EMS
- 2,90722.0%Service Call
- 2,58519.6%Fire
- 1,91714.5%Hazardous Condition
- 1,37610.4%Good Intent Call
- 9617.3%False Alarm
- 650.5%Severe Weather
- 450.3%Special Incident
- 220.2%Overpressure Rupture
- Fire incident types reported to NFIRS in Easley, SC
- 1,19746.3%Outside Fires
- 94136.4%Structure Fires
- 40415.6%Mobile Property/Vehicle Fires
- 431.7%Other
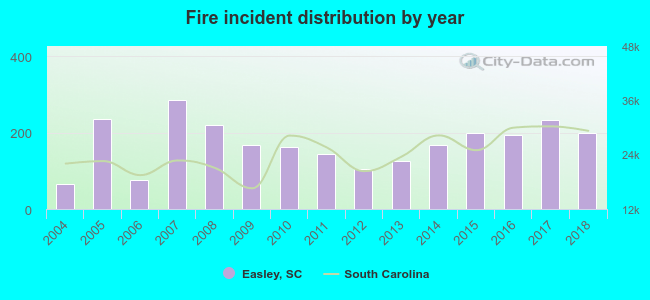 According to the data from the years 2004 - 2018 the average number of fires per year is 172. The highest number of fire incidents - 285 took place in 2007, and the least - 65 in 2004. The data has a growing trend.
The average number of yearly fire incidents per 10k residents in Easley, SC compared to nearest cities:
(Note: Based on data for the last 3 years, including only cities with population 5,000 and above)
| Easley: | 102.0 |
| Powderville: | 49.0 |
| Berea: | 0.7 |
| Piedmont: | 313.5 |
| Gantt: | 0.7 |
| Greenville: | 183.0 |
| Central: | 54.4 |
| Clemson: | 40.7 |
| Mauldin: | 30.6 |
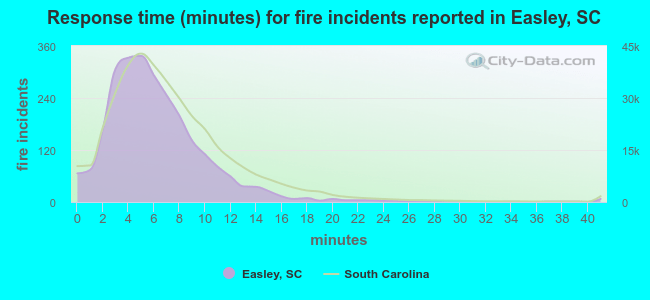 The median response time based on all reported fire incidents is 6 minutes. This is similar to the South Carolina median value.
The median response time in Easley, SC compared to nearest cities:
(Note: Based on data for all years, including only cities with at least 500 fire incidents)
| Easley: | 6 minutes |
| Liberty: | 6 minutes |
| Pickens: | 7 minutes |
| Piedmont: | 6 minutes |
| Greenville: | 4 minutes |
| Central: | 6 minutes |
| Six Mile: | 7 minutes |
| Travelers Rest: | 7 minutes |
| Pelzer: | 6 minutes |
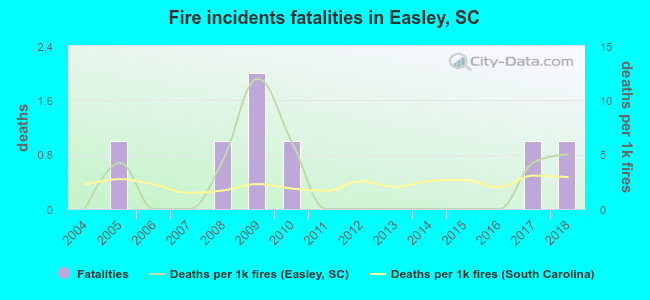 According to the reports from the years 2004 - 2018 the average number of fire-related yearly deaths is 0. The highest number of deaths - 2 took place in 2009, and the lowest - 0 in 2004. The data has a rising trend.
The average number of fatalities per 1,000 fire incidents is 2. This indicator was the highest - 12 in 2009, and the lowest 0 in 2004. The trend for fatalities per 1,000 fires is increasing. Compared to the South Carolina value the number of deaths per 1,000 fires is similar.
According to the reports from the years 2004 - 2018 the average number of fire-related yearly deaths is 0. The highest number of deaths - 2 took place in 2009, and the lowest - 0 in 2004. The data has a rising trend.
The average number of fatalities per 1,000 fire incidents is 2. This indicator was the highest - 12 in 2009, and the lowest 0 in 2004. The trend for fatalities per 1,000 fires is increasing. Compared to the South Carolina value the number of deaths per 1,000 fires is similar.Deaths per 1,000 incidents in Easley, SC compared to nearest cities:
(Note: Based on data for all years, including only cities with at least 2,500 fire incidents)
| Easley: | 2.7 |
| Greenville: | 1.8 |
| Anderson: | 3.0 |
| Greer: | 3.9 |
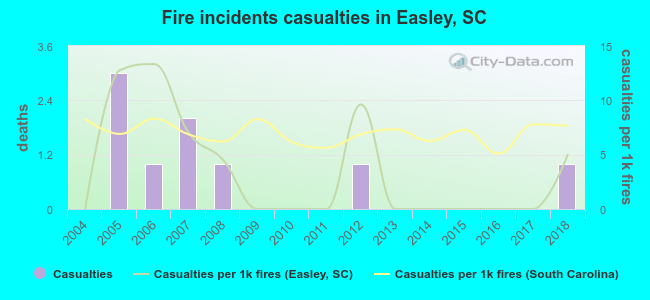 According to the reports from the years 2004 - 2018 the average number of fire-related casualties per year is 1. The highest number of reported casualties - 3 took place in 2005, and the lowest - 0 in 2004. The data has a rising trend.
The average number of injuries per 1,000 fire incidents is 3. This indicator was the highest - 13 in 2006, and the lowest 0 in 2004. The trend for casualties per 1,000 fires is increasing. Compared to the state value the number of injuries per 1,000 fire incidents is much lower.
According to the reports from the years 2004 - 2018 the average number of fire-related casualties per year is 1. The highest number of reported casualties - 3 took place in 2005, and the lowest - 0 in 2004. The data has a rising trend.
The average number of injuries per 1,000 fire incidents is 3. This indicator was the highest - 13 in 2006, and the lowest 0 in 2004. The trend for casualties per 1,000 fires is increasing. Compared to the state value the number of injuries per 1,000 fire incidents is much lower.Casualties per 1,000 incidents in Easley, SC compared to nearest cities:
(Note: Based on data for all years, including only cities with at least 500 fire incidents)
| Easley: | 3.5 |
| Liberty: | 0.9 |
| Pickens: | 1.8 |
| Piedmont: | 3.8 |
| Greenville: | 7.3 |
| Central: | 3.3 |
| Six Mile: | 1.8 |
| Travelers Rest: | 1.5 |
| Pelzer: | 1.4 |
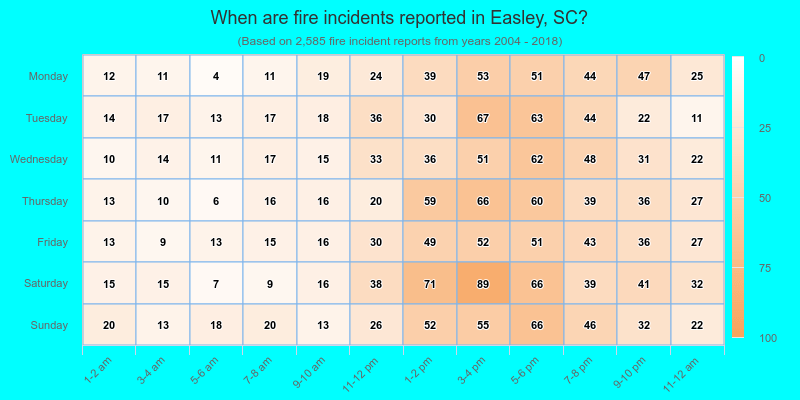
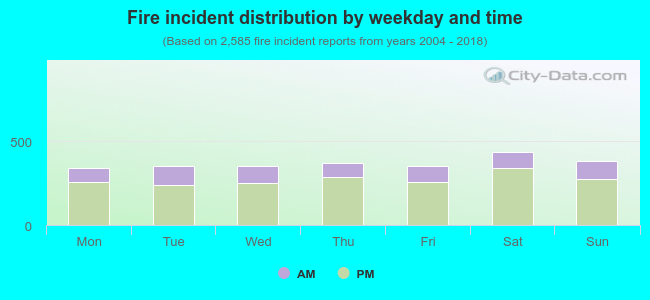 26.4% incidents where reported in the morning and 73.6% in the evening. The most fires (16.9%) took place on Saturday, and the least (13.2%) on Monday.
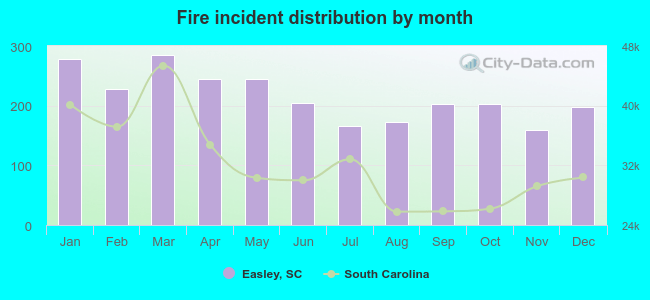 Based on the 2,585 reports from years 2004 - 2018 most fires (11.0%) took place during March, and the least (6.2%) in November.
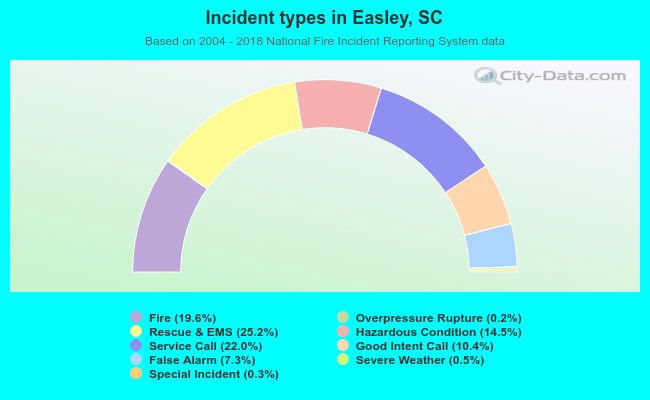 Out of all 13,208 cases reported during the years 2004 - 2018, the most belonged to the categories: Rescue & EMS (25.2%), Service Call (22.0%), and Fire (19.6%).
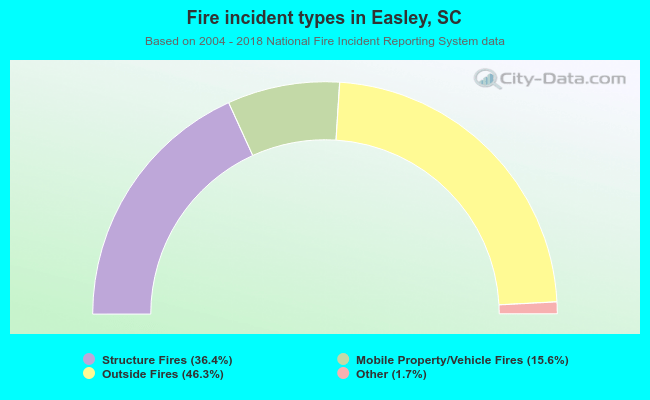 When looking into fire subcategories, the most reports belonged to: Outside Fires (46.3%), and Structure Fires (36.4%).