East Brunswick: Fire Incidents, New Jersey (NJ)
Where are fire incidents reported in East Brunswick, NJ
Something went wrong! Please refresh the page.
| Fire incidents reported | |
|---|---|
| Sreet name | Count |
| ROUTE 18 | 272 |
| CRANBURY RD | 98 |
| NJ TPKE | 84 |
| ROUTE 18 RT | 84 |
| NEW BRUNSWICK AVE | 68 |
| NEW BRUNSWICK | 42 |
| RIVA AVE | 42 |
| MILLTOWN RD | 36 |
| OLD BRIDGE TPKE | 36 |
| TICES LANE | 32 |
| DUNHAMS CORNER RD | 30 |
| EDGEBORO RD | 30 |
| NEW JERSEY TURNPIKE | 30 |
| CIVIC CENTER DR | 28 |
| RYDERS LANE | 26 |
| NEW JERSEY TPKE | 24 |
| TOWER CENTER BLVD | 24 |
| MAIN ST | 20 |
| WILLOW ST | 20 |
| DUTCH RD | 18 |
| GATES AVE | 18 |
| HIGHWAY 18 | 18 |
| LAKE AVE | 18 |
| SR-18 HWY | 18 |
| SUMMERHILL RD | 18 |
| MERRILL AVE | 16 |
| NEW JERSEY TURNPIKE TPKE | 16 |
| RT 18 | 16 |
| BRICK PLANT RD | 14 |
| CHURCH LN | 14 |
| Other | 223 |
2002 - 2018 National Fire Incident Reporting System (NFIRS) incidents
- Incident types reported to NFIRS in East Brunswick, NJ
- 1,73433.6%Hazardous Condition
- 1,43327.8%Fire
- 1,20723.4%False Alarm
- 2985.8%Good Intent Call
- 2775.4%Service Call
- 1663.2%Rescue & EMS
- 170.3%Overpressure Rupture
- 160.3%Special Incident
- 150.3%Severe Weather
- Fire incident types reported to NFIRS in East Brunswick, NJ
- 67046.8%Structure Fires
- 39827.8%Outside Fires
- 30221.1%Mobile Property/Vehicle Fires
- 634.4%Other
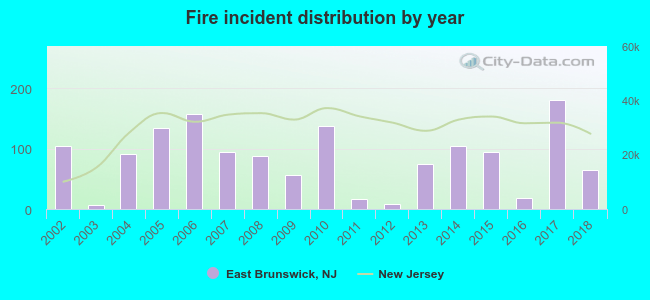 Based on the data from the years 2002 - 2018 the average number of fires per year is 84. The highest number of fires - 180 took place in 2017, and the least - 6 in 2003. The data has a decreasing trend.
The average number of yearly fire incidents per 10k residents in East Brunswick, NJ compared to nearest cities:
(Note: Based on data for the last 3 years, including only cities with population 5,000 and above)
| East Brunswick: | 18.2 |
| South River: | 15.5 |
| Milltown: | 17.5 |
| Spotswood: | 16.0 |
| New Brunswick: | 21.3 |
| Old Bridge: | 38.9 |
| Highland Park: | 19.4 |
| Sayreville: | 11.2 |
| Somerset: | 43.2 |
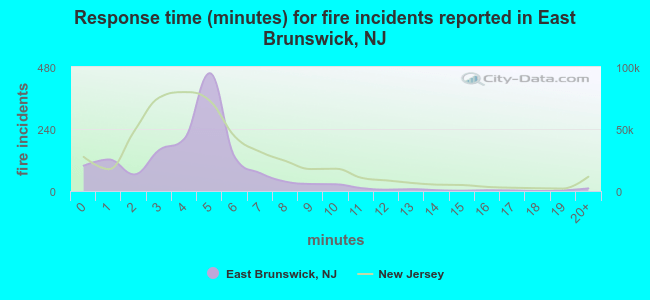 The median response time based on all reported fire incidents is 5 minutes. This is similar to the New Jersey median value.
The median response time in East Brunswick, NJ compared to nearest cities:
(Note: Based on data for all years, including only cities with at least 500 fire incidents)
| East Brunswick: | 5 minutes |
| New Brunswick: | 3 minutes |
| Old Bridge: | 4 minutes |
| Highland Park: | 2 minutes |
| Sayreville: | 5 minutes |
| Voorhees: | 6 minutes |
| Somerset: | 8 minutes |
| South Amboy: | 3 minutes |
| Monmouth Junction: | 6 minutes |
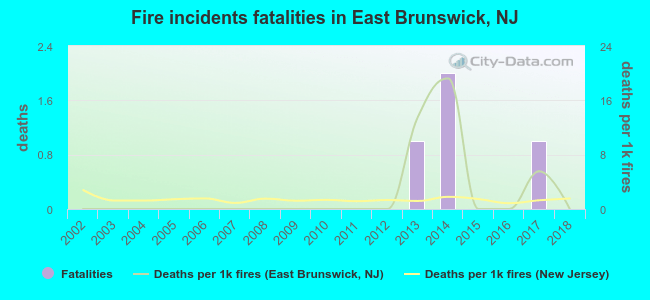 Based on the reports from the years 2002 - 2018 the average number of fire-related yearly deaths is 0. The highest number of deaths - 2 took place in 2014, and the lowest - 0 in 2002. The data has a constant trend.
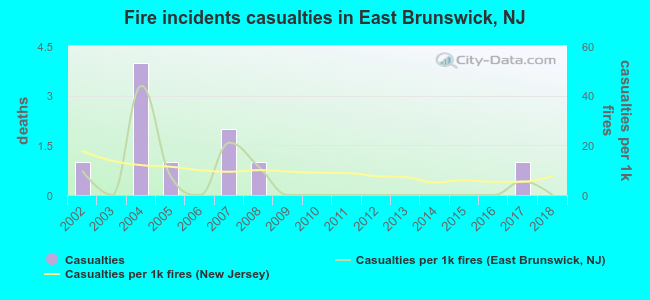 Based on the data from the years 2002 - 2018 the average number of fire-related yearly casualties is 1. The highest number of reported injuries - 4 took place in 2004, and the lowest - 0 in 2003. The data has a dropping trend.
The average number of casualties per 1,000 fire incidents is 6. This indicator was the highest - 44 in 2004, and the lowest 0 in 2003. The trend for injuries per 1,000 incidents is declining. Compared to the state value the number of injuries per 1,000 fires is lower.
Based on the data from the years 2002 - 2018 the average number of fire-related yearly casualties is 1. The highest number of reported injuries - 4 took place in 2004, and the lowest - 0 in 2003. The data has a dropping trend.
The average number of casualties per 1,000 fire incidents is 6. This indicator was the highest - 44 in 2004, and the lowest 0 in 2003. The trend for injuries per 1,000 incidents is declining. Compared to the state value the number of injuries per 1,000 fires is lower.Casualties per 1,000 incidents in East Brunswick, NJ compared to nearest cities:
(Note: Based on data for all years, including only cities with at least 500 fire incidents)
| East Brunswick: | 7.0 |
| New Brunswick: | 11.6 |
| Old Bridge: | 9.9 |
| Highland Park: | 7.3 |
| Sayreville: | 17.3 |
| Voorhees: | 2.7 |
| Somerset: | 5.0 |
| South Amboy: | 13.2 |
| Monmouth Junction: | 15.6 |
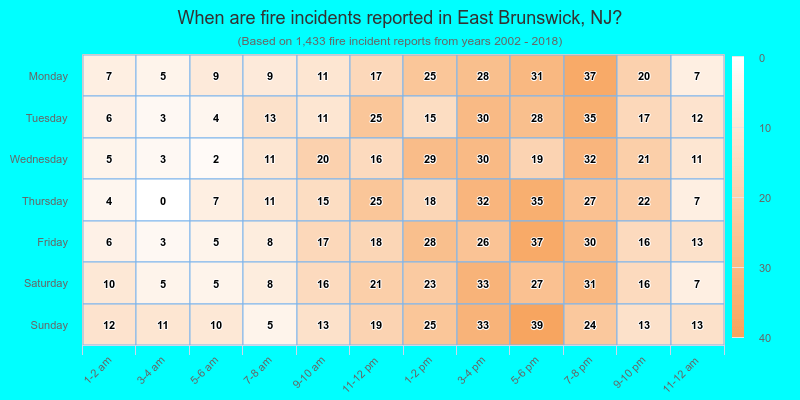
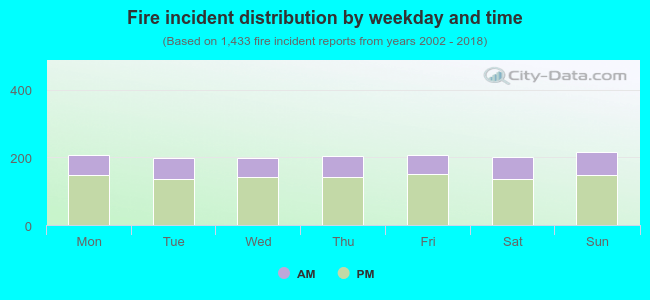 30.1% incidents where reported in the morning and 69.9% in the evening. The most fires (15.1%) took place on Sunday, and the least (13.9%) on Tuesday.
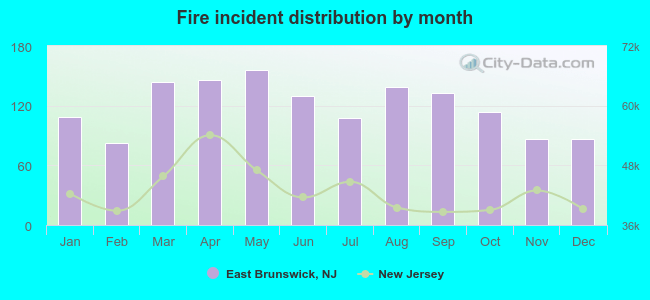 According to the 1,433 fires from years 2002 - 2018 most fires (10.9%) took place during May, and the least (5.7%) in February.
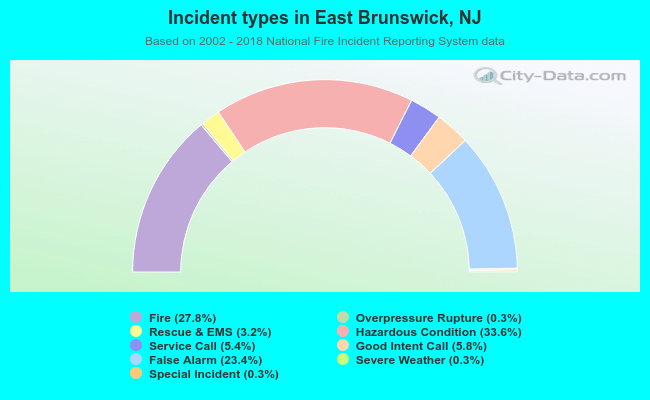 Out of all 5,163 cases reported during the years 2002 - 2018, the most belonged to the categories: Hazardous Condition (33.6%), Fire (27.8%), and False Alarm (23.4%).
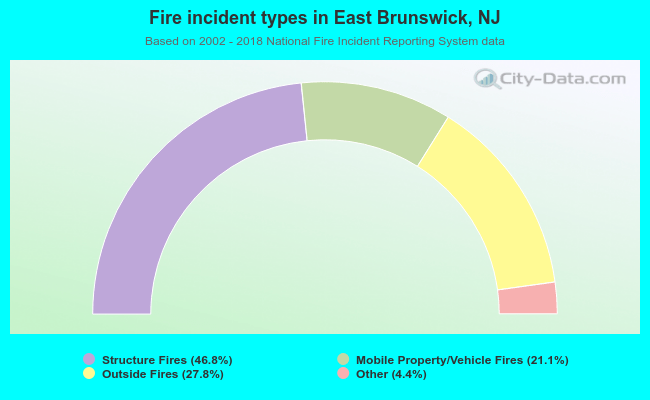 When looking into fire subcategories, the most incidents belonged to: Structure Fires (46.8%), and Outside Fires (27.8%).